
API Manager Stack
Run Kong Server + Konga + Prometheus + Grafana + API & DDBB + Graylog
Clone the proyect and run docker-compose up
sudo git clone https://github.com/safernandez666/Kong-API-Manager.git && cd Kong-API-Manager

sudo chown -R $USER $PWD

sudo chmod +x kong-start.sh

sh kong-start.sh
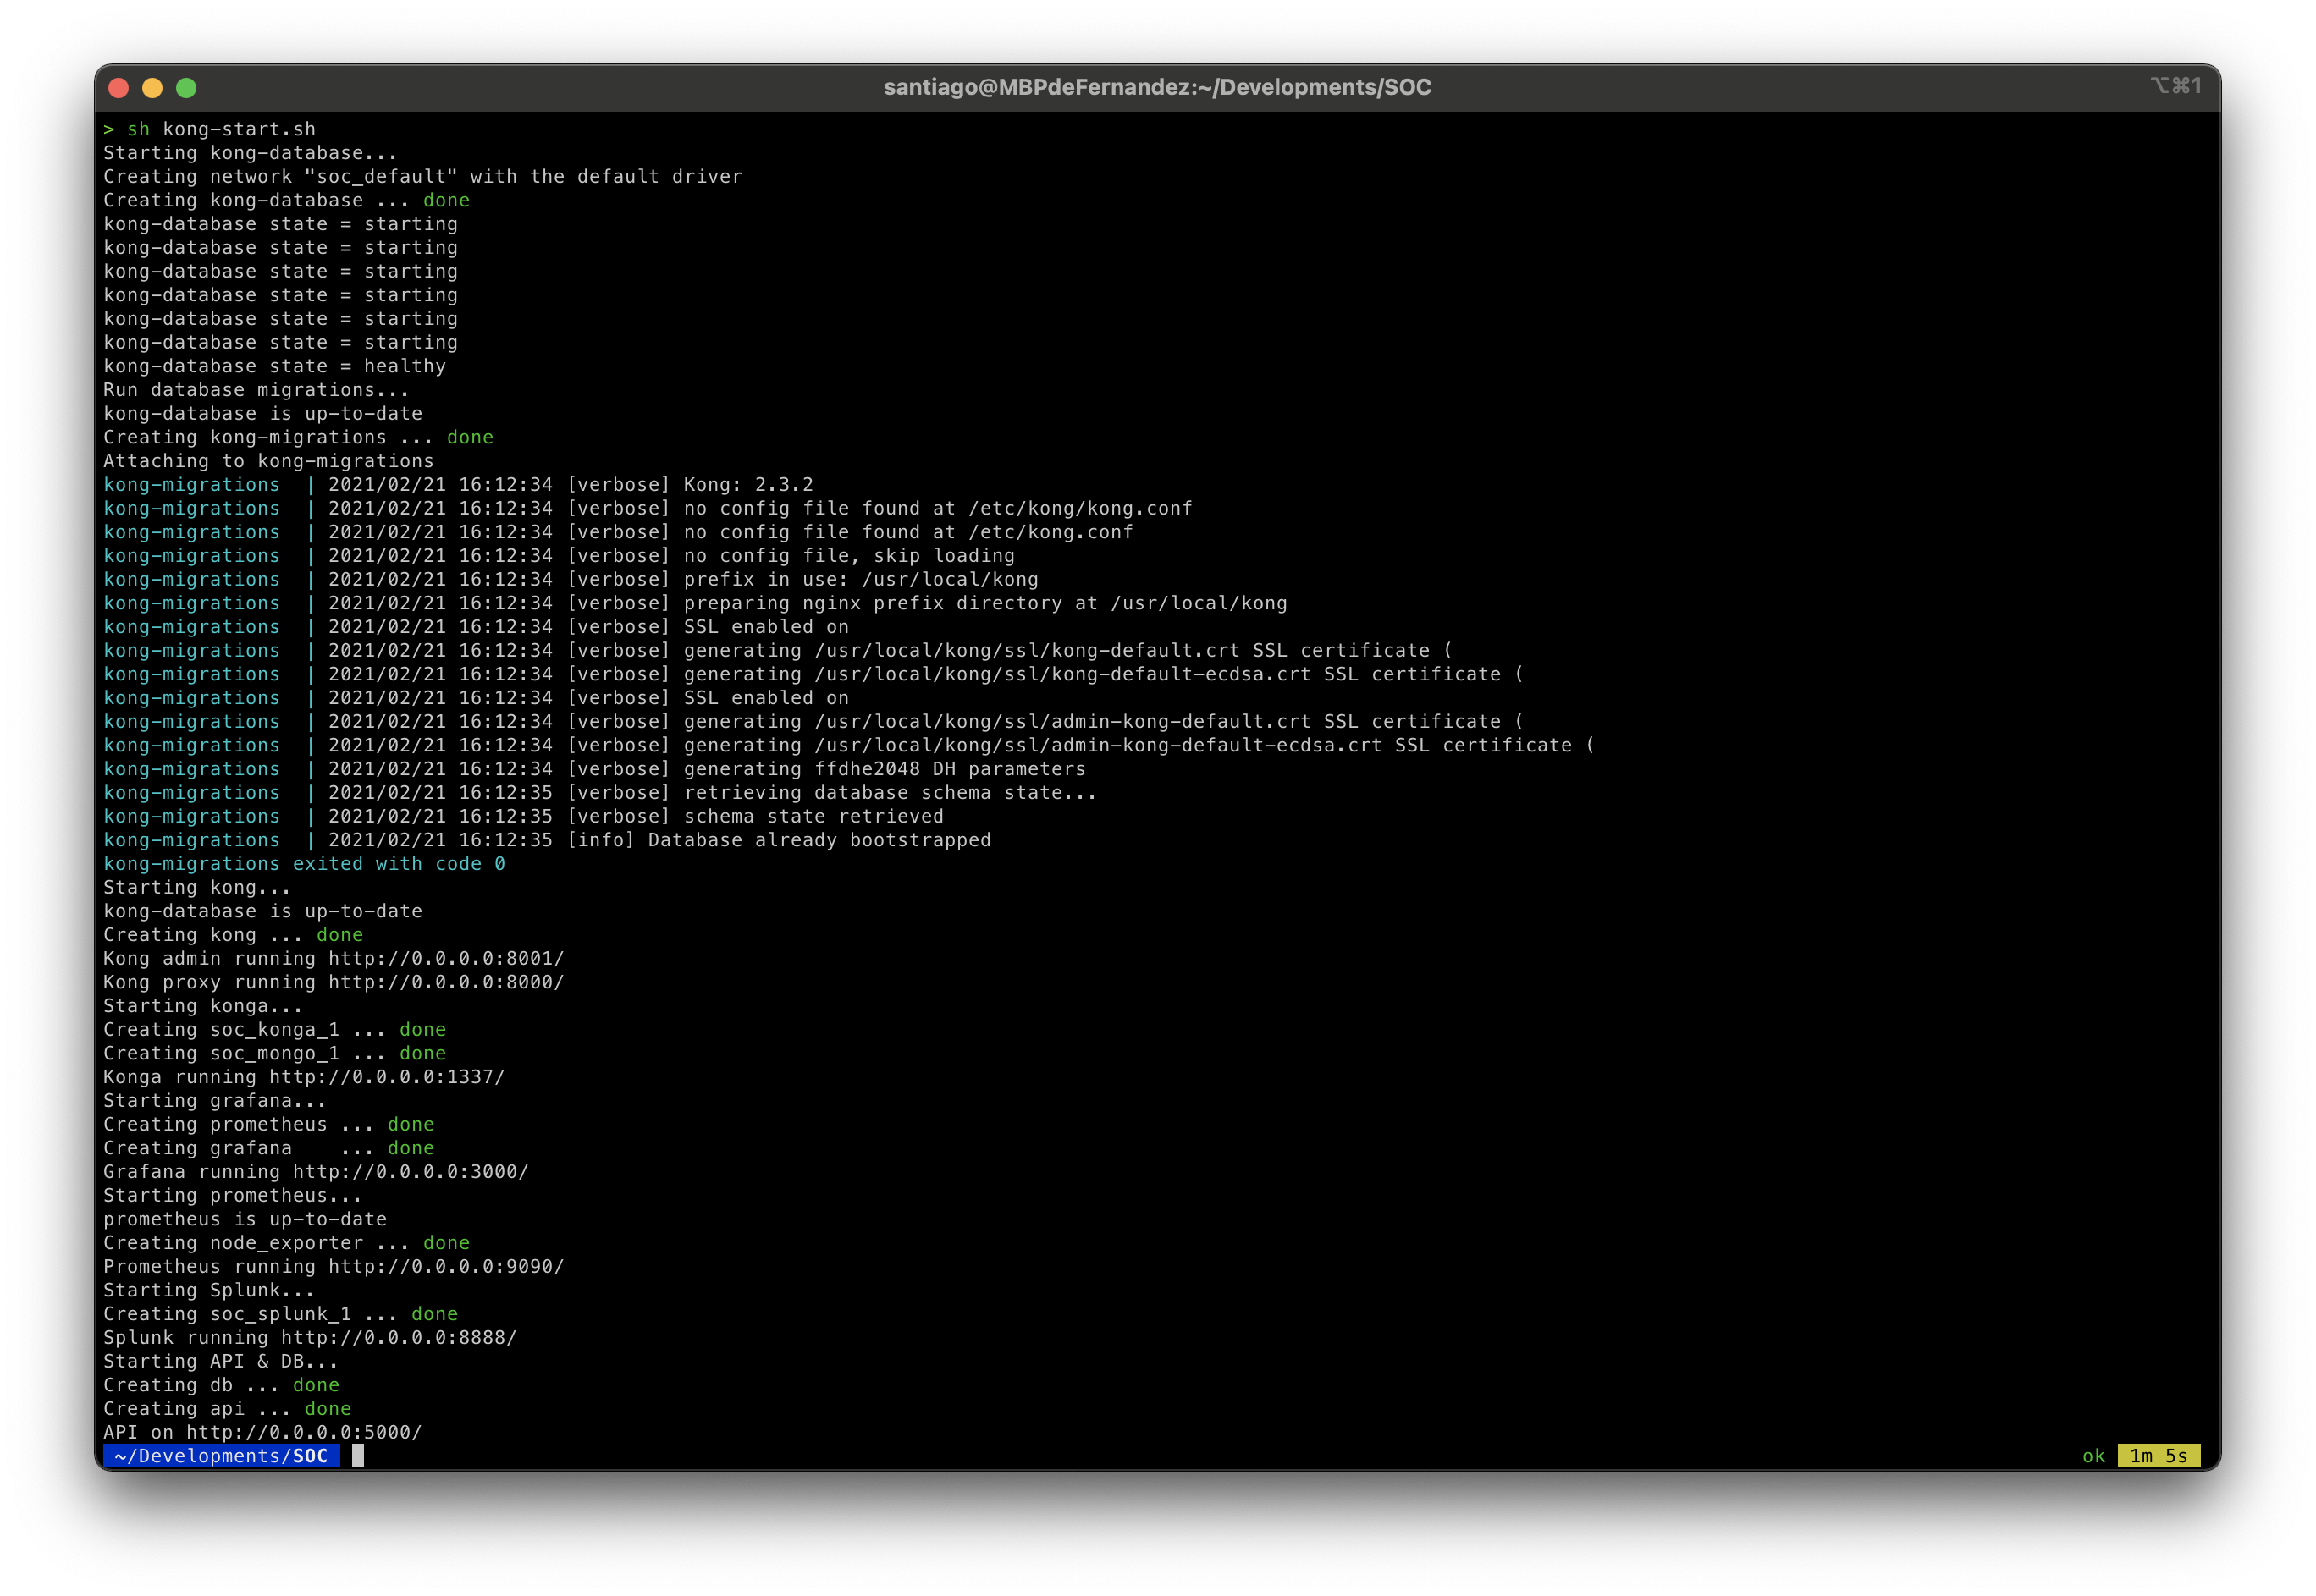
Running the stack
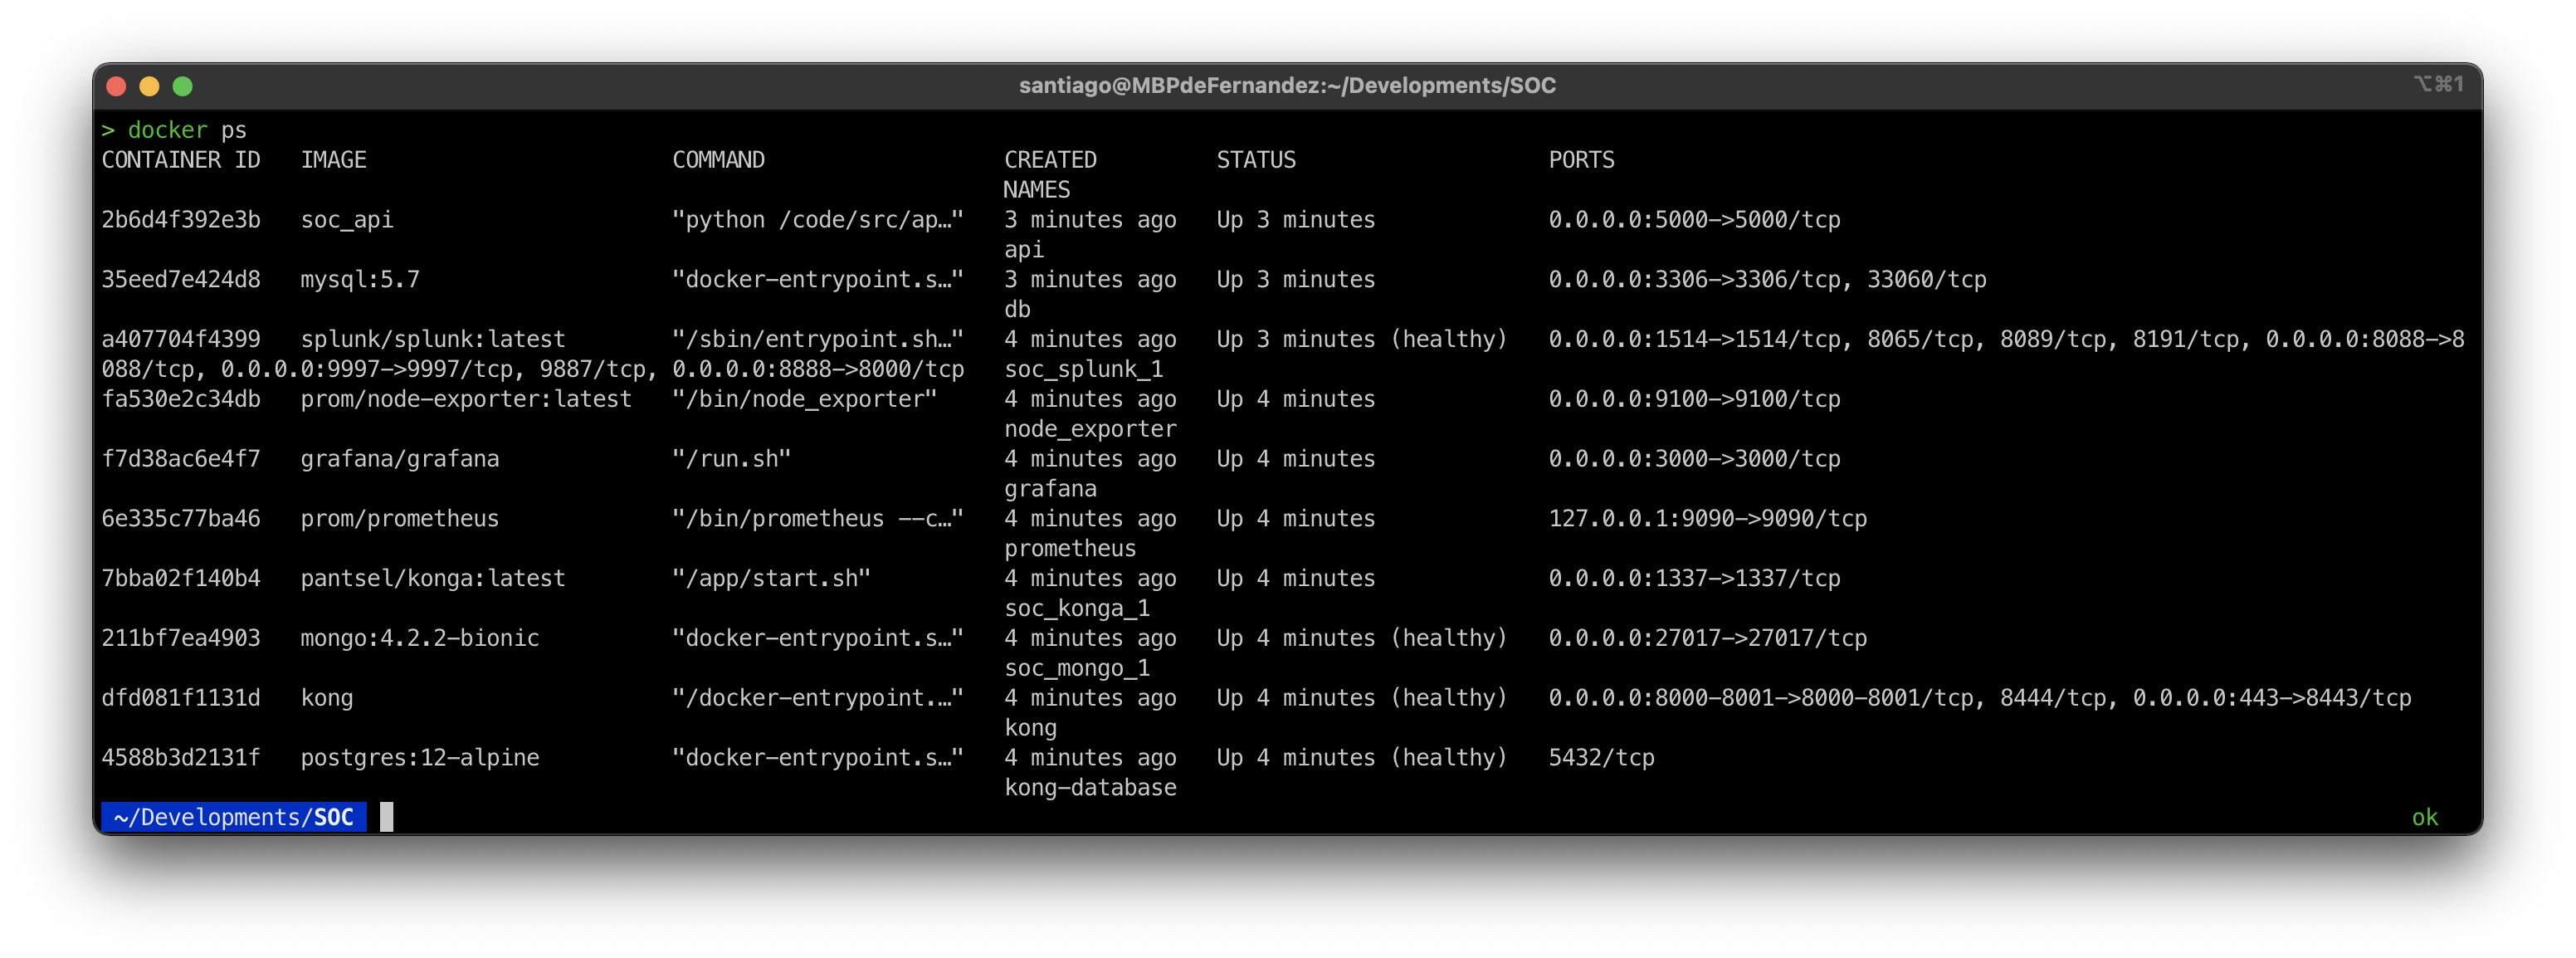
Containers
Check the name of the containers for future configurations.
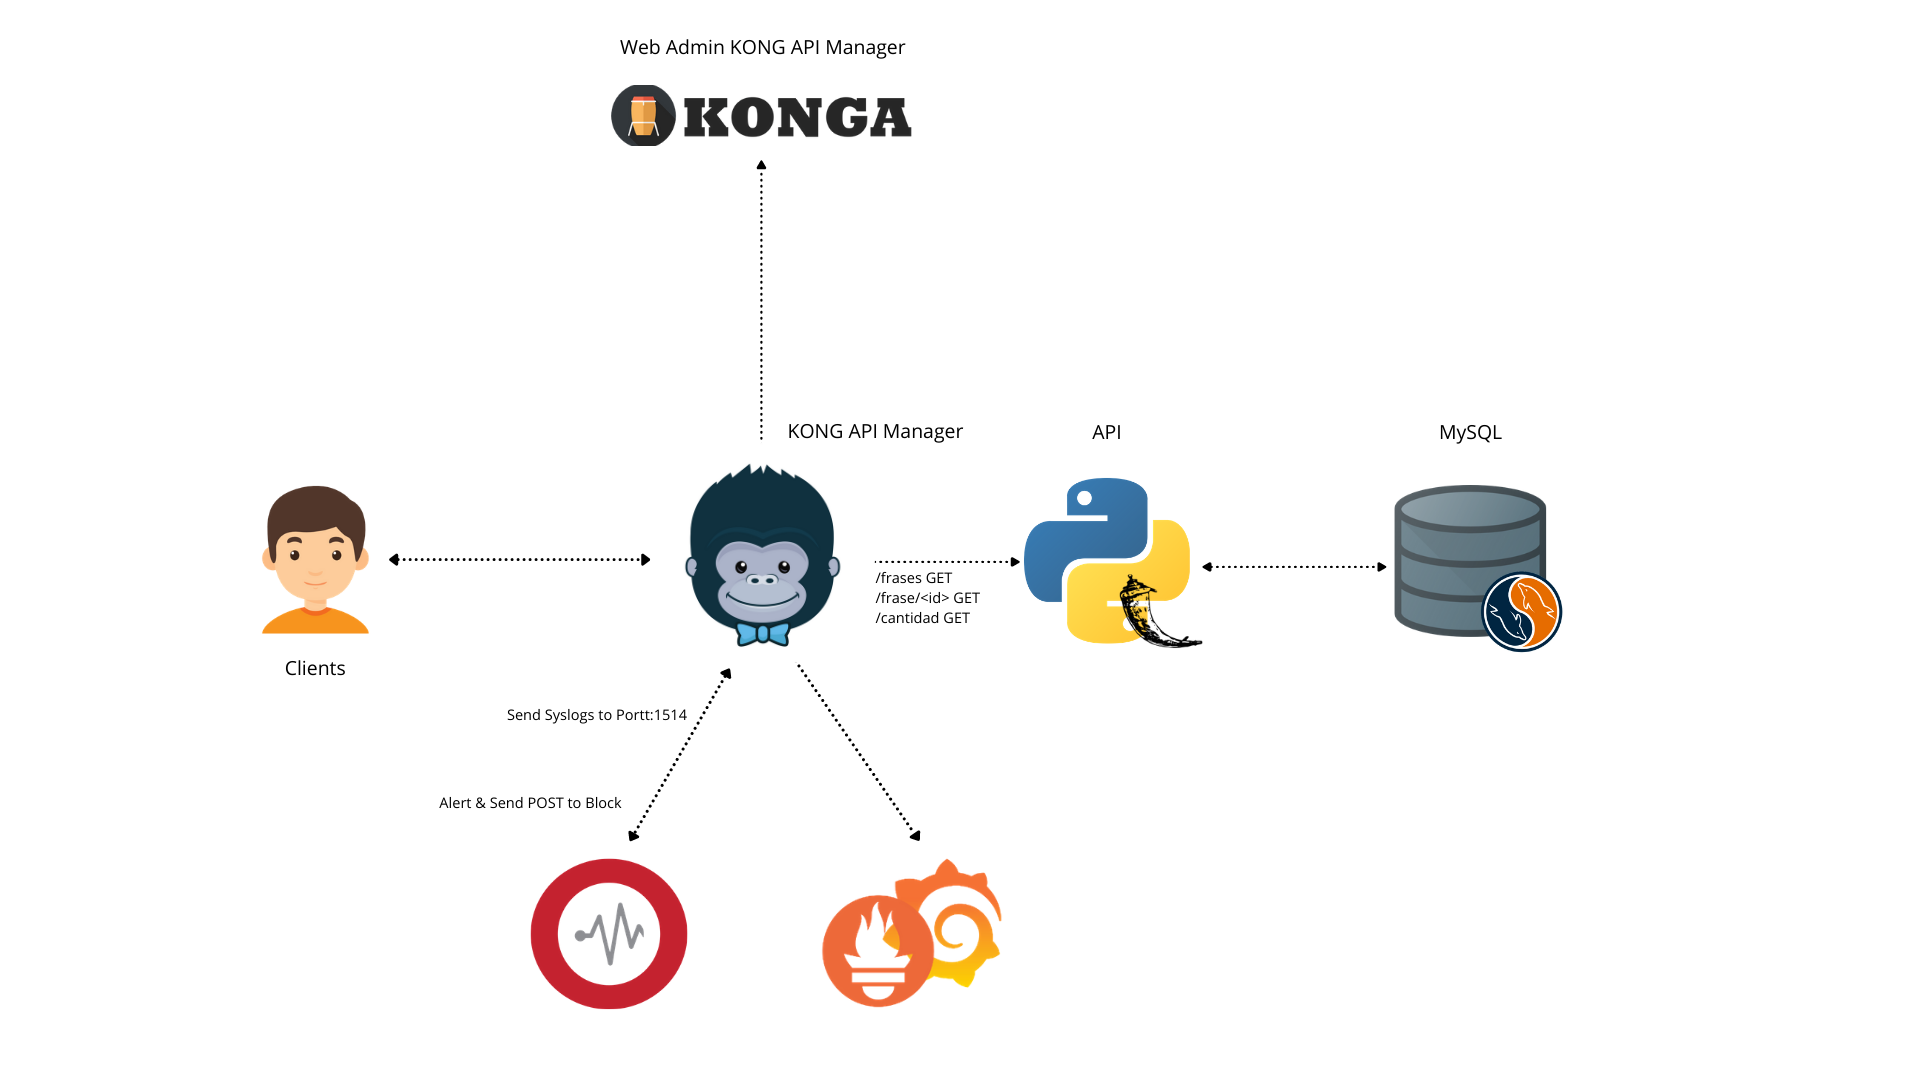
Architecture
Create Service on Kong
curl -i -X POST
--url http://localhost:8001/services/
--data 'name=MyAPI'
--data 'url=http://api:5000'
Test
curl -i http://localhost:8001/services/MyAPI
Create Route on the Service
curl -i -X POST http://localhost:8001/services/MyAPI/routes
--data 'paths[]=/'
--data name=main
Test
curl -i -X GET http://localhost:8000/request
Konga GUI
Enter on http://localhost:1337
I create the Username and Password on kus.js. It's important change the Password.
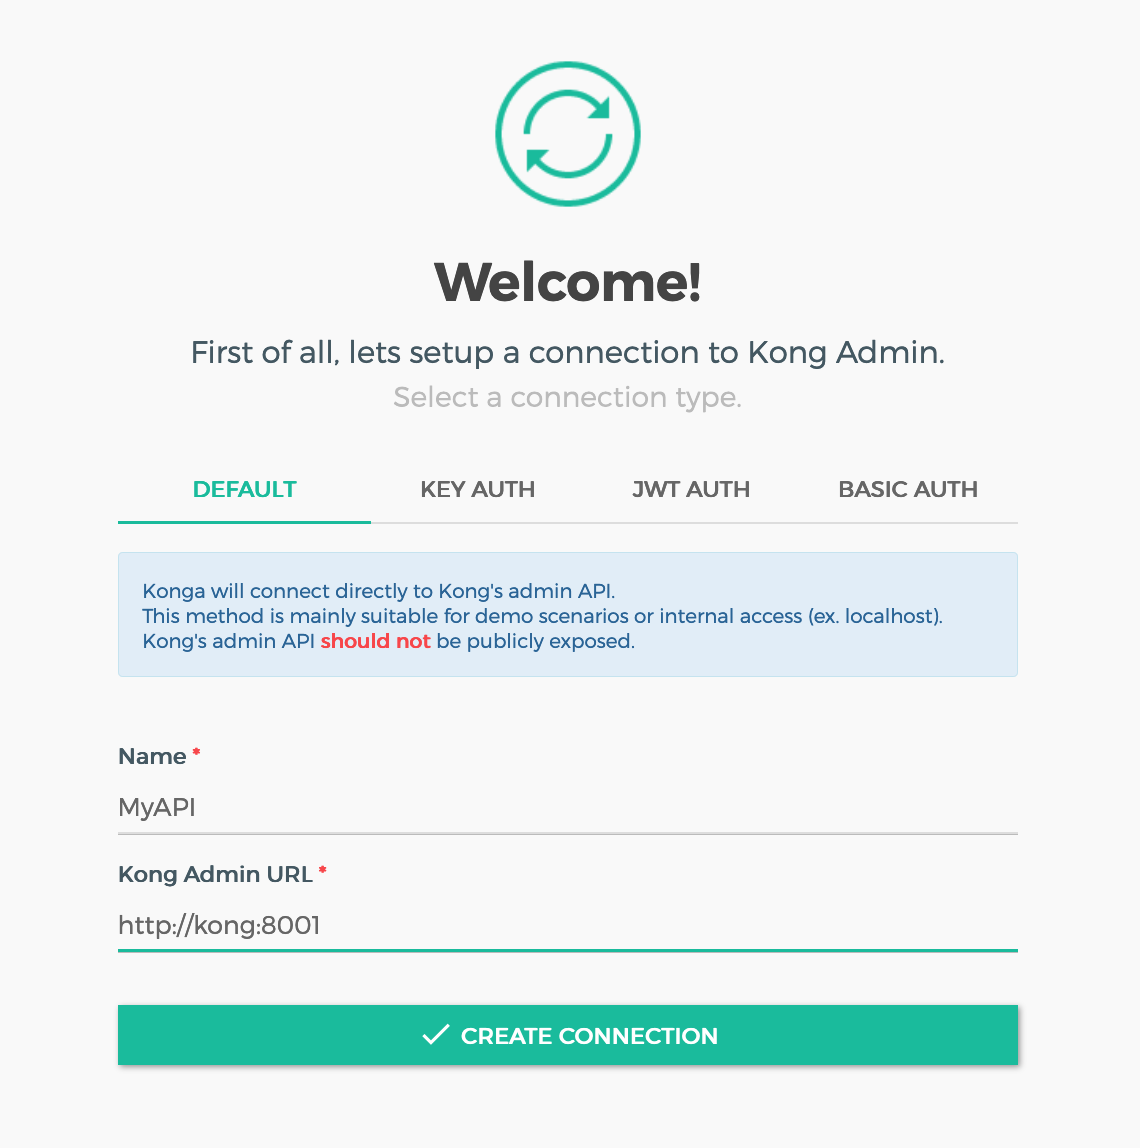
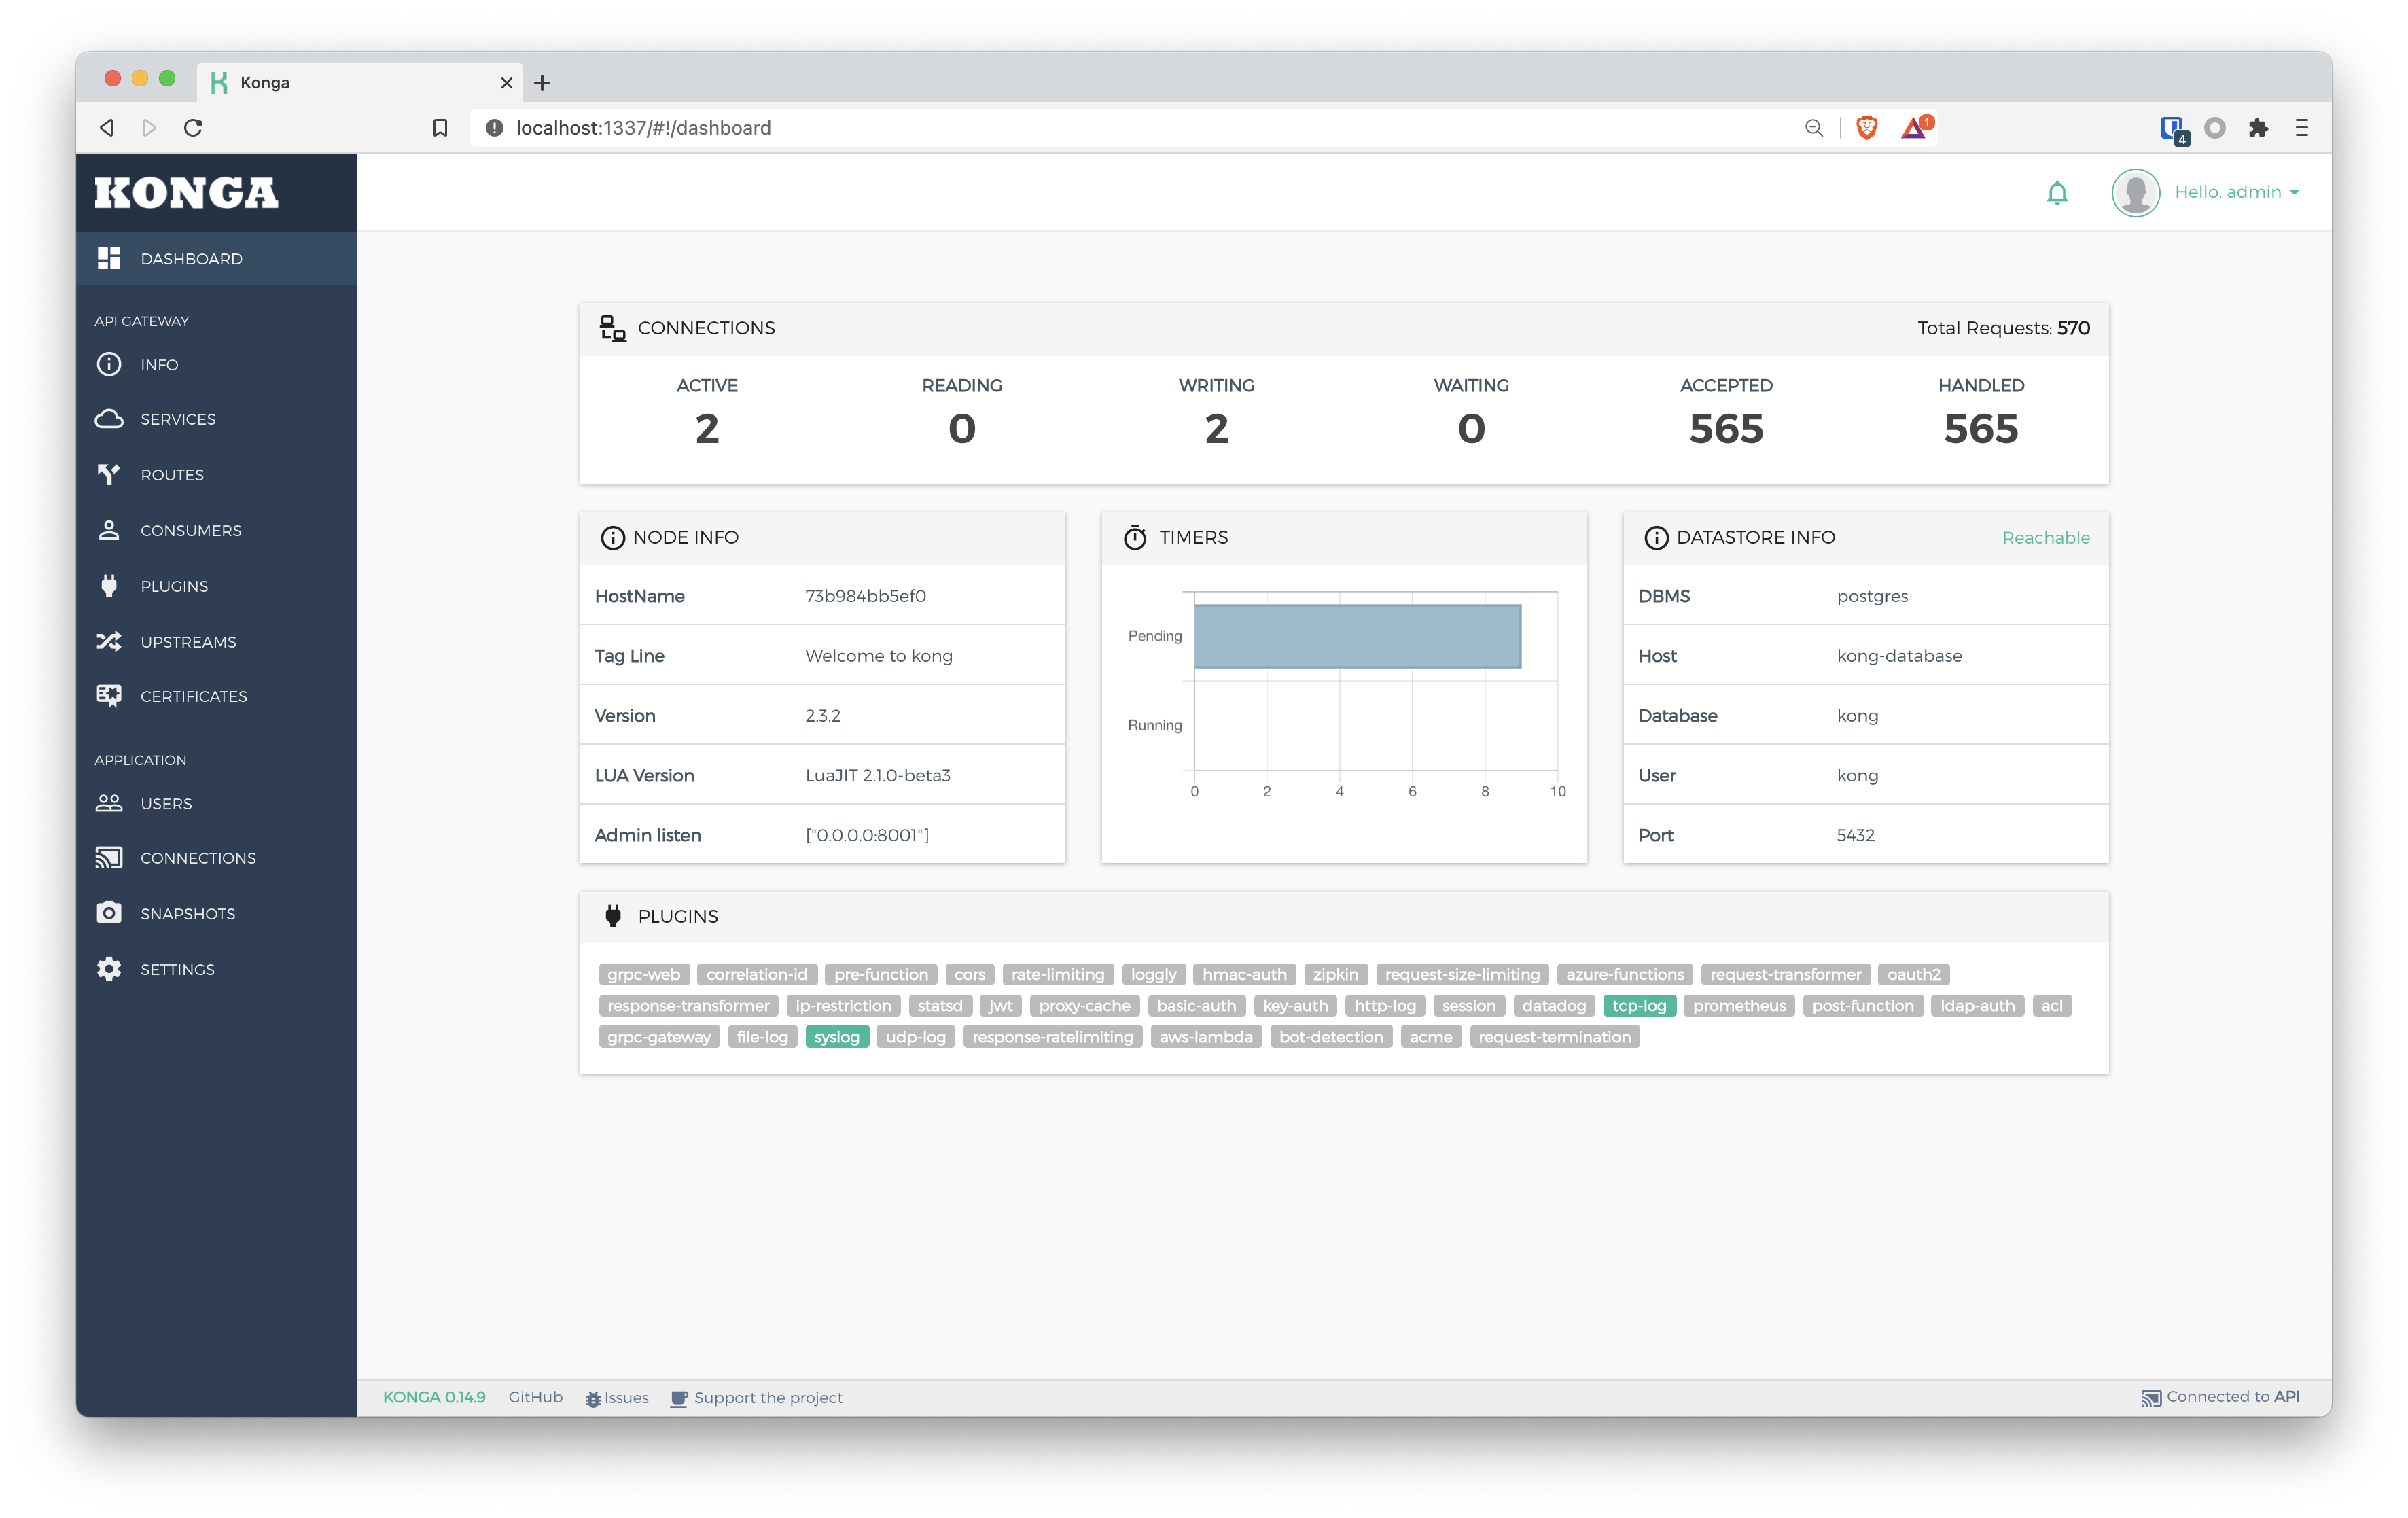
Create the connection
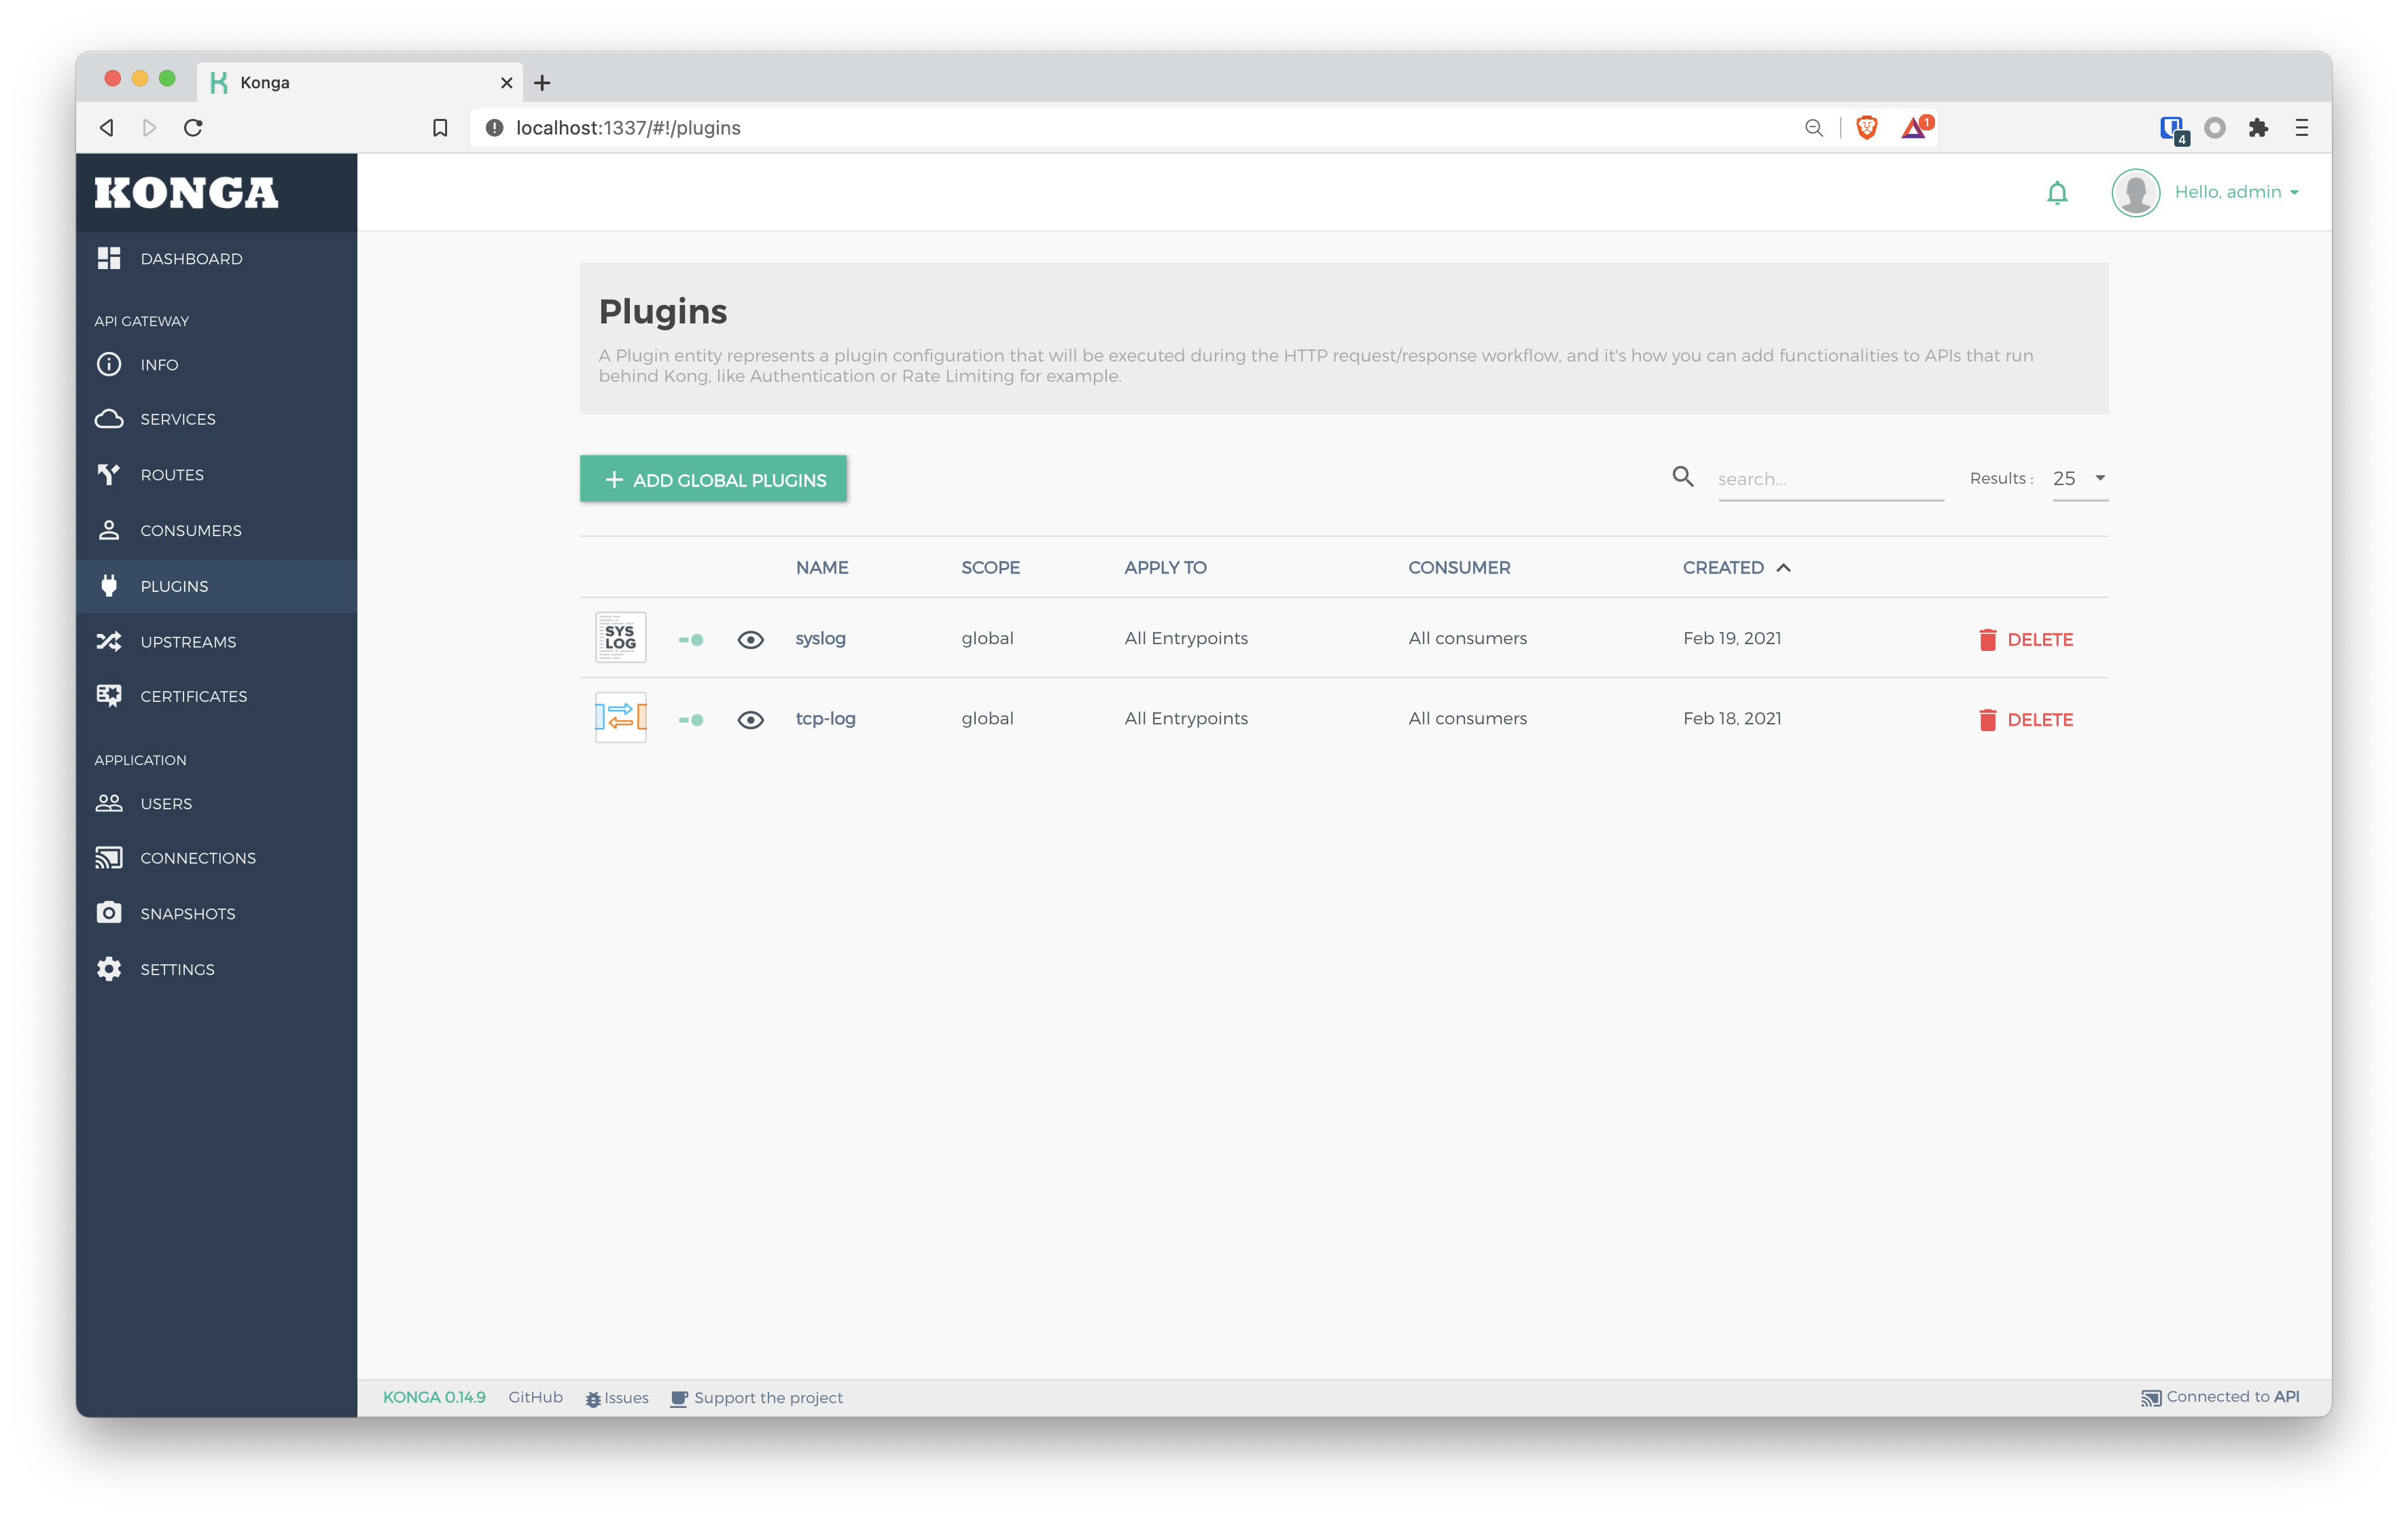
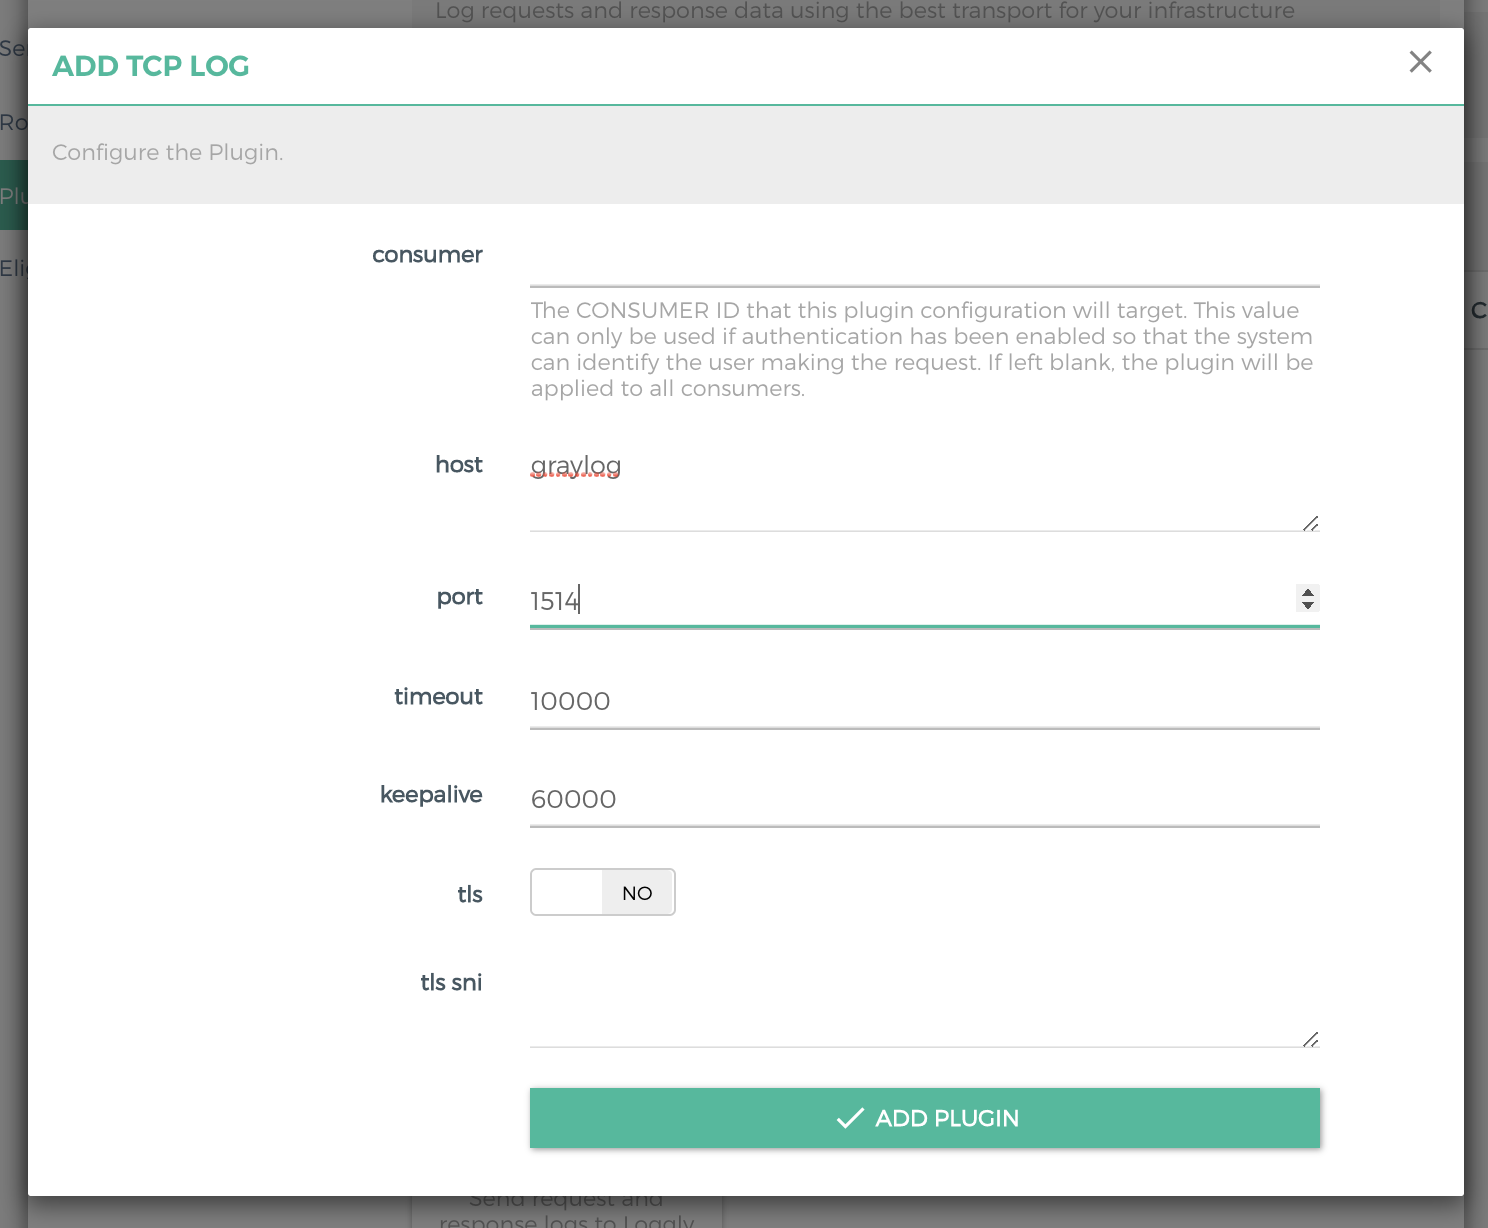
Add plug-in and send logs to Splunk
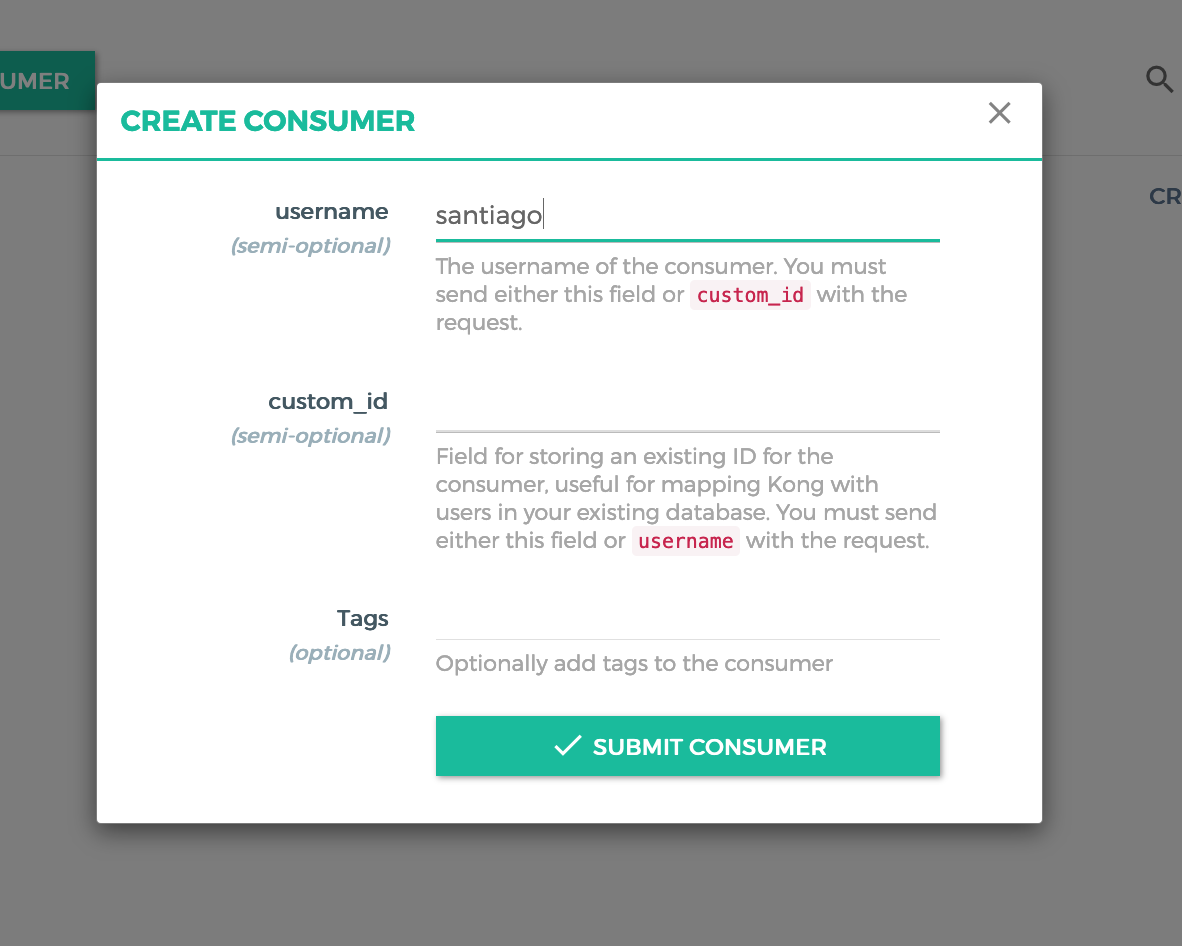
Let's add some security. For this, a Customer is necessary, add an Authentication method and then associate it with the route.
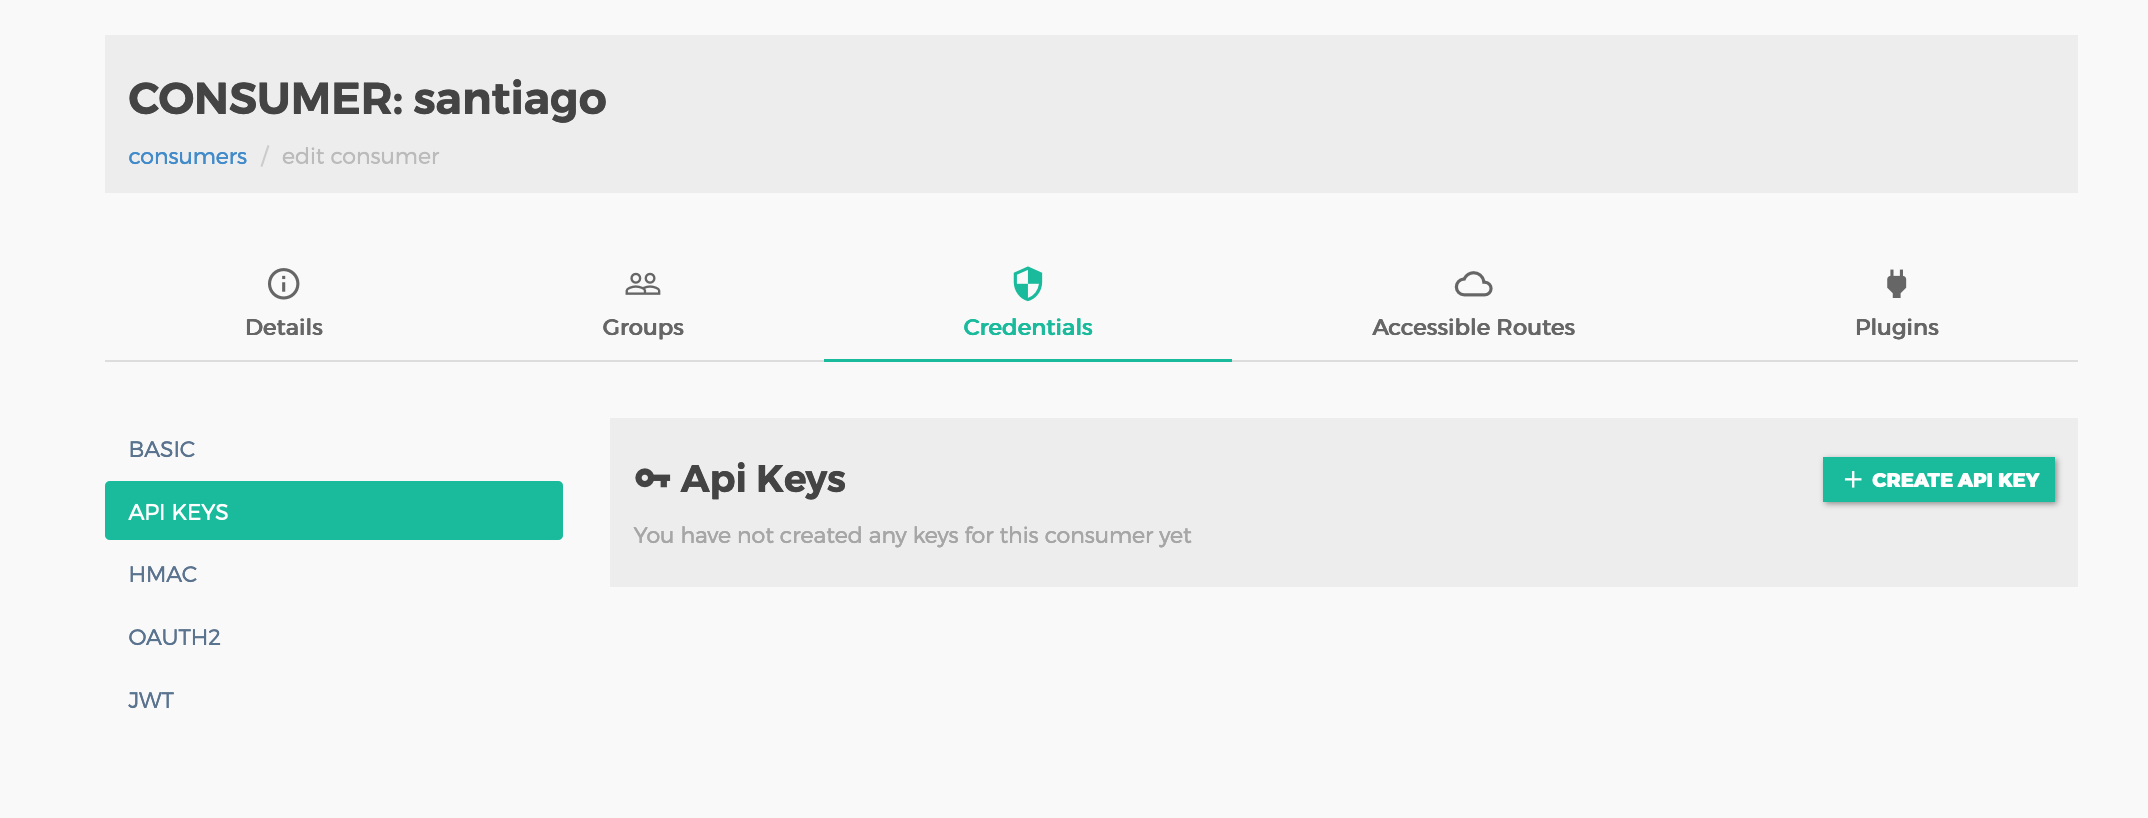
Create mi Customer: santiago
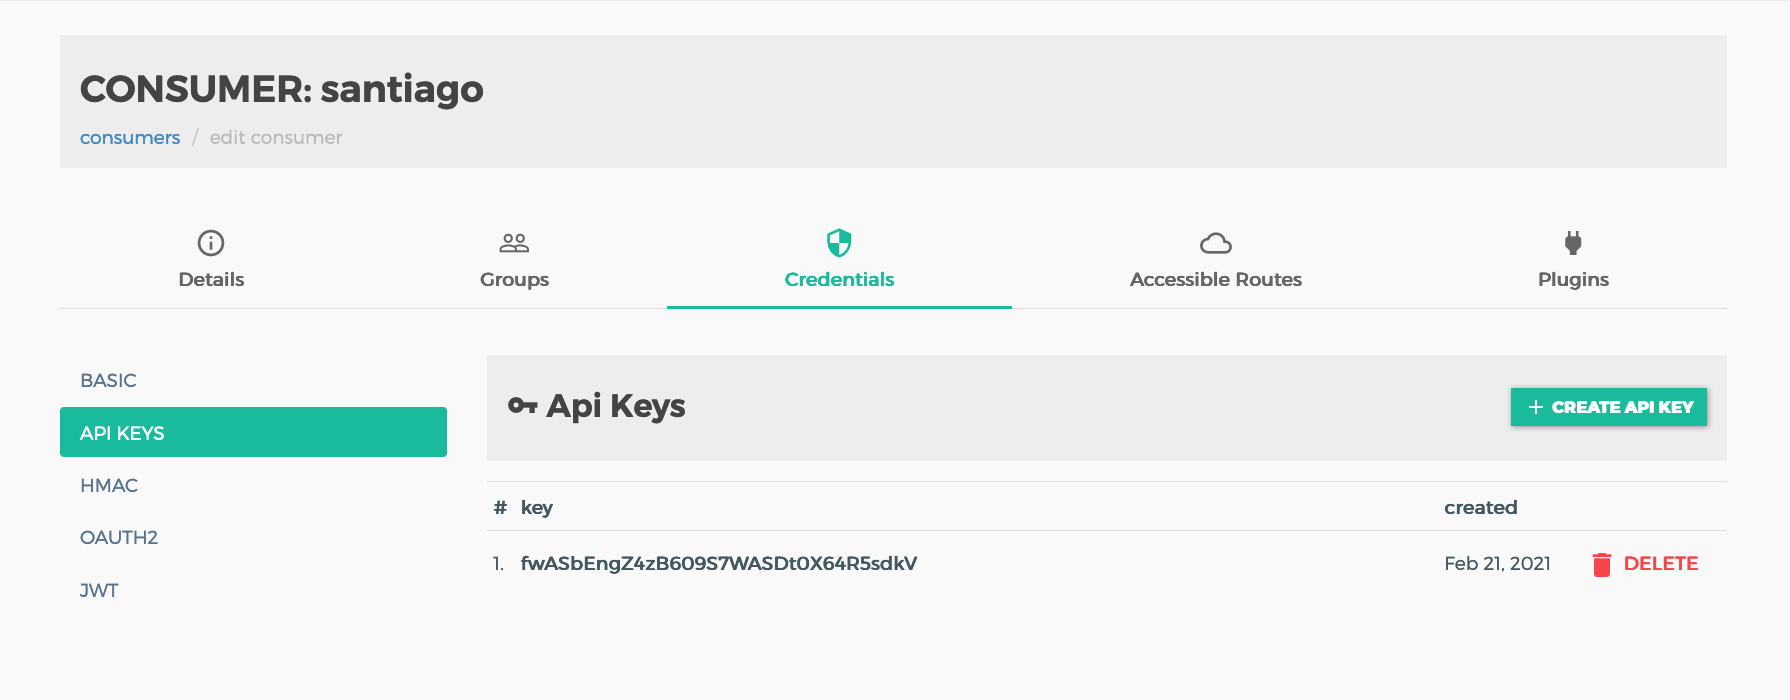
Generate my API KEY
My API KEY
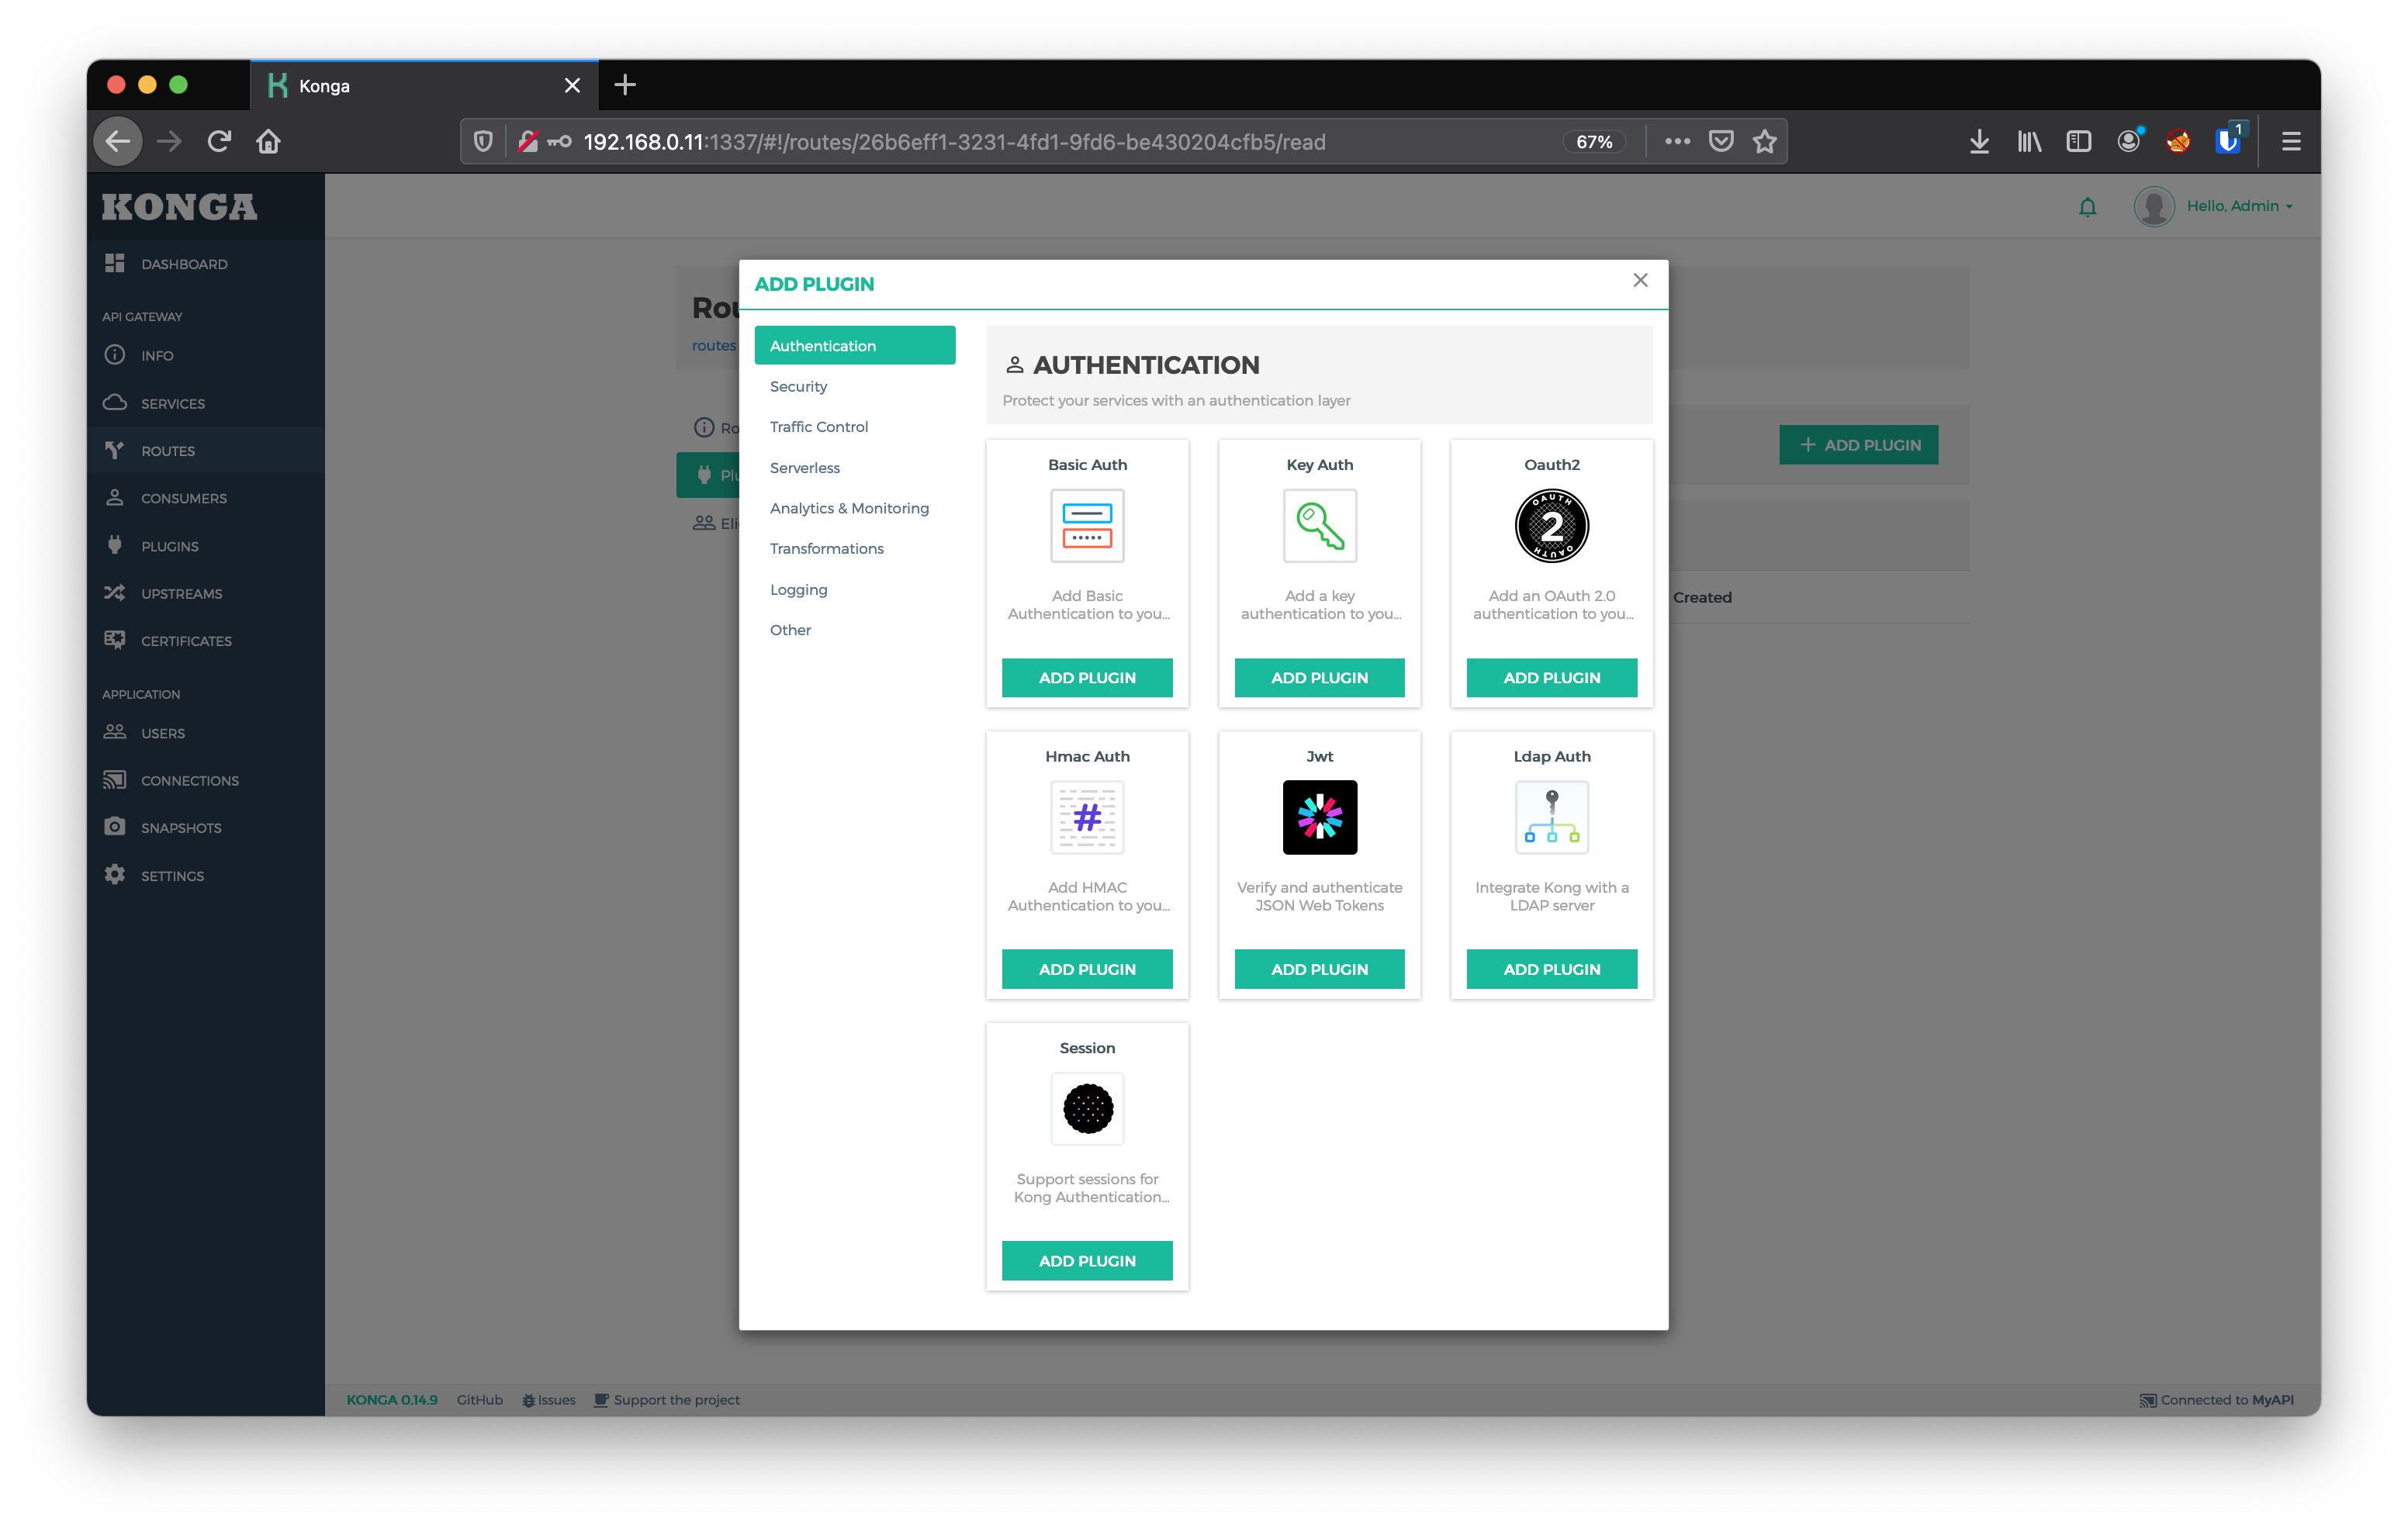
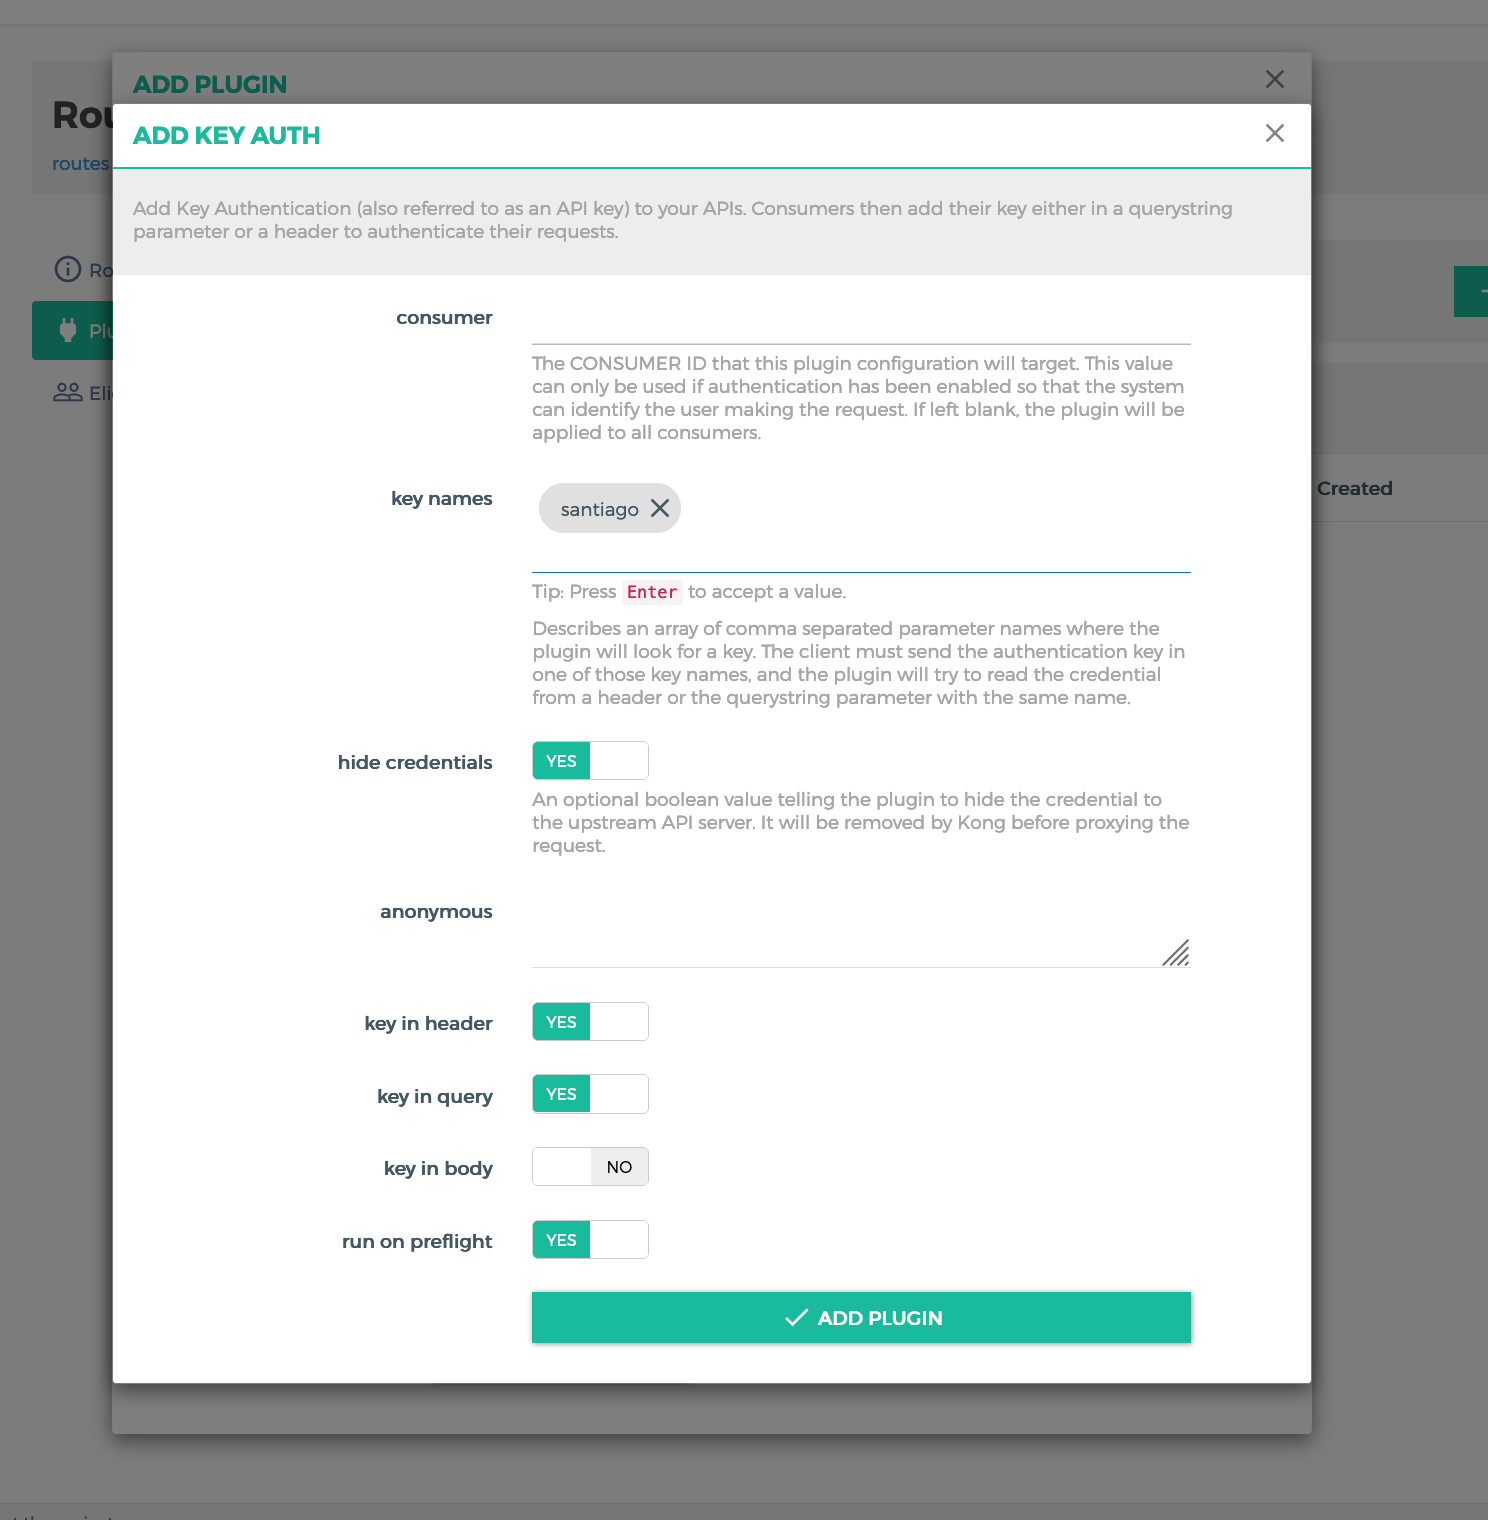
On the route, add the use of the API Key.
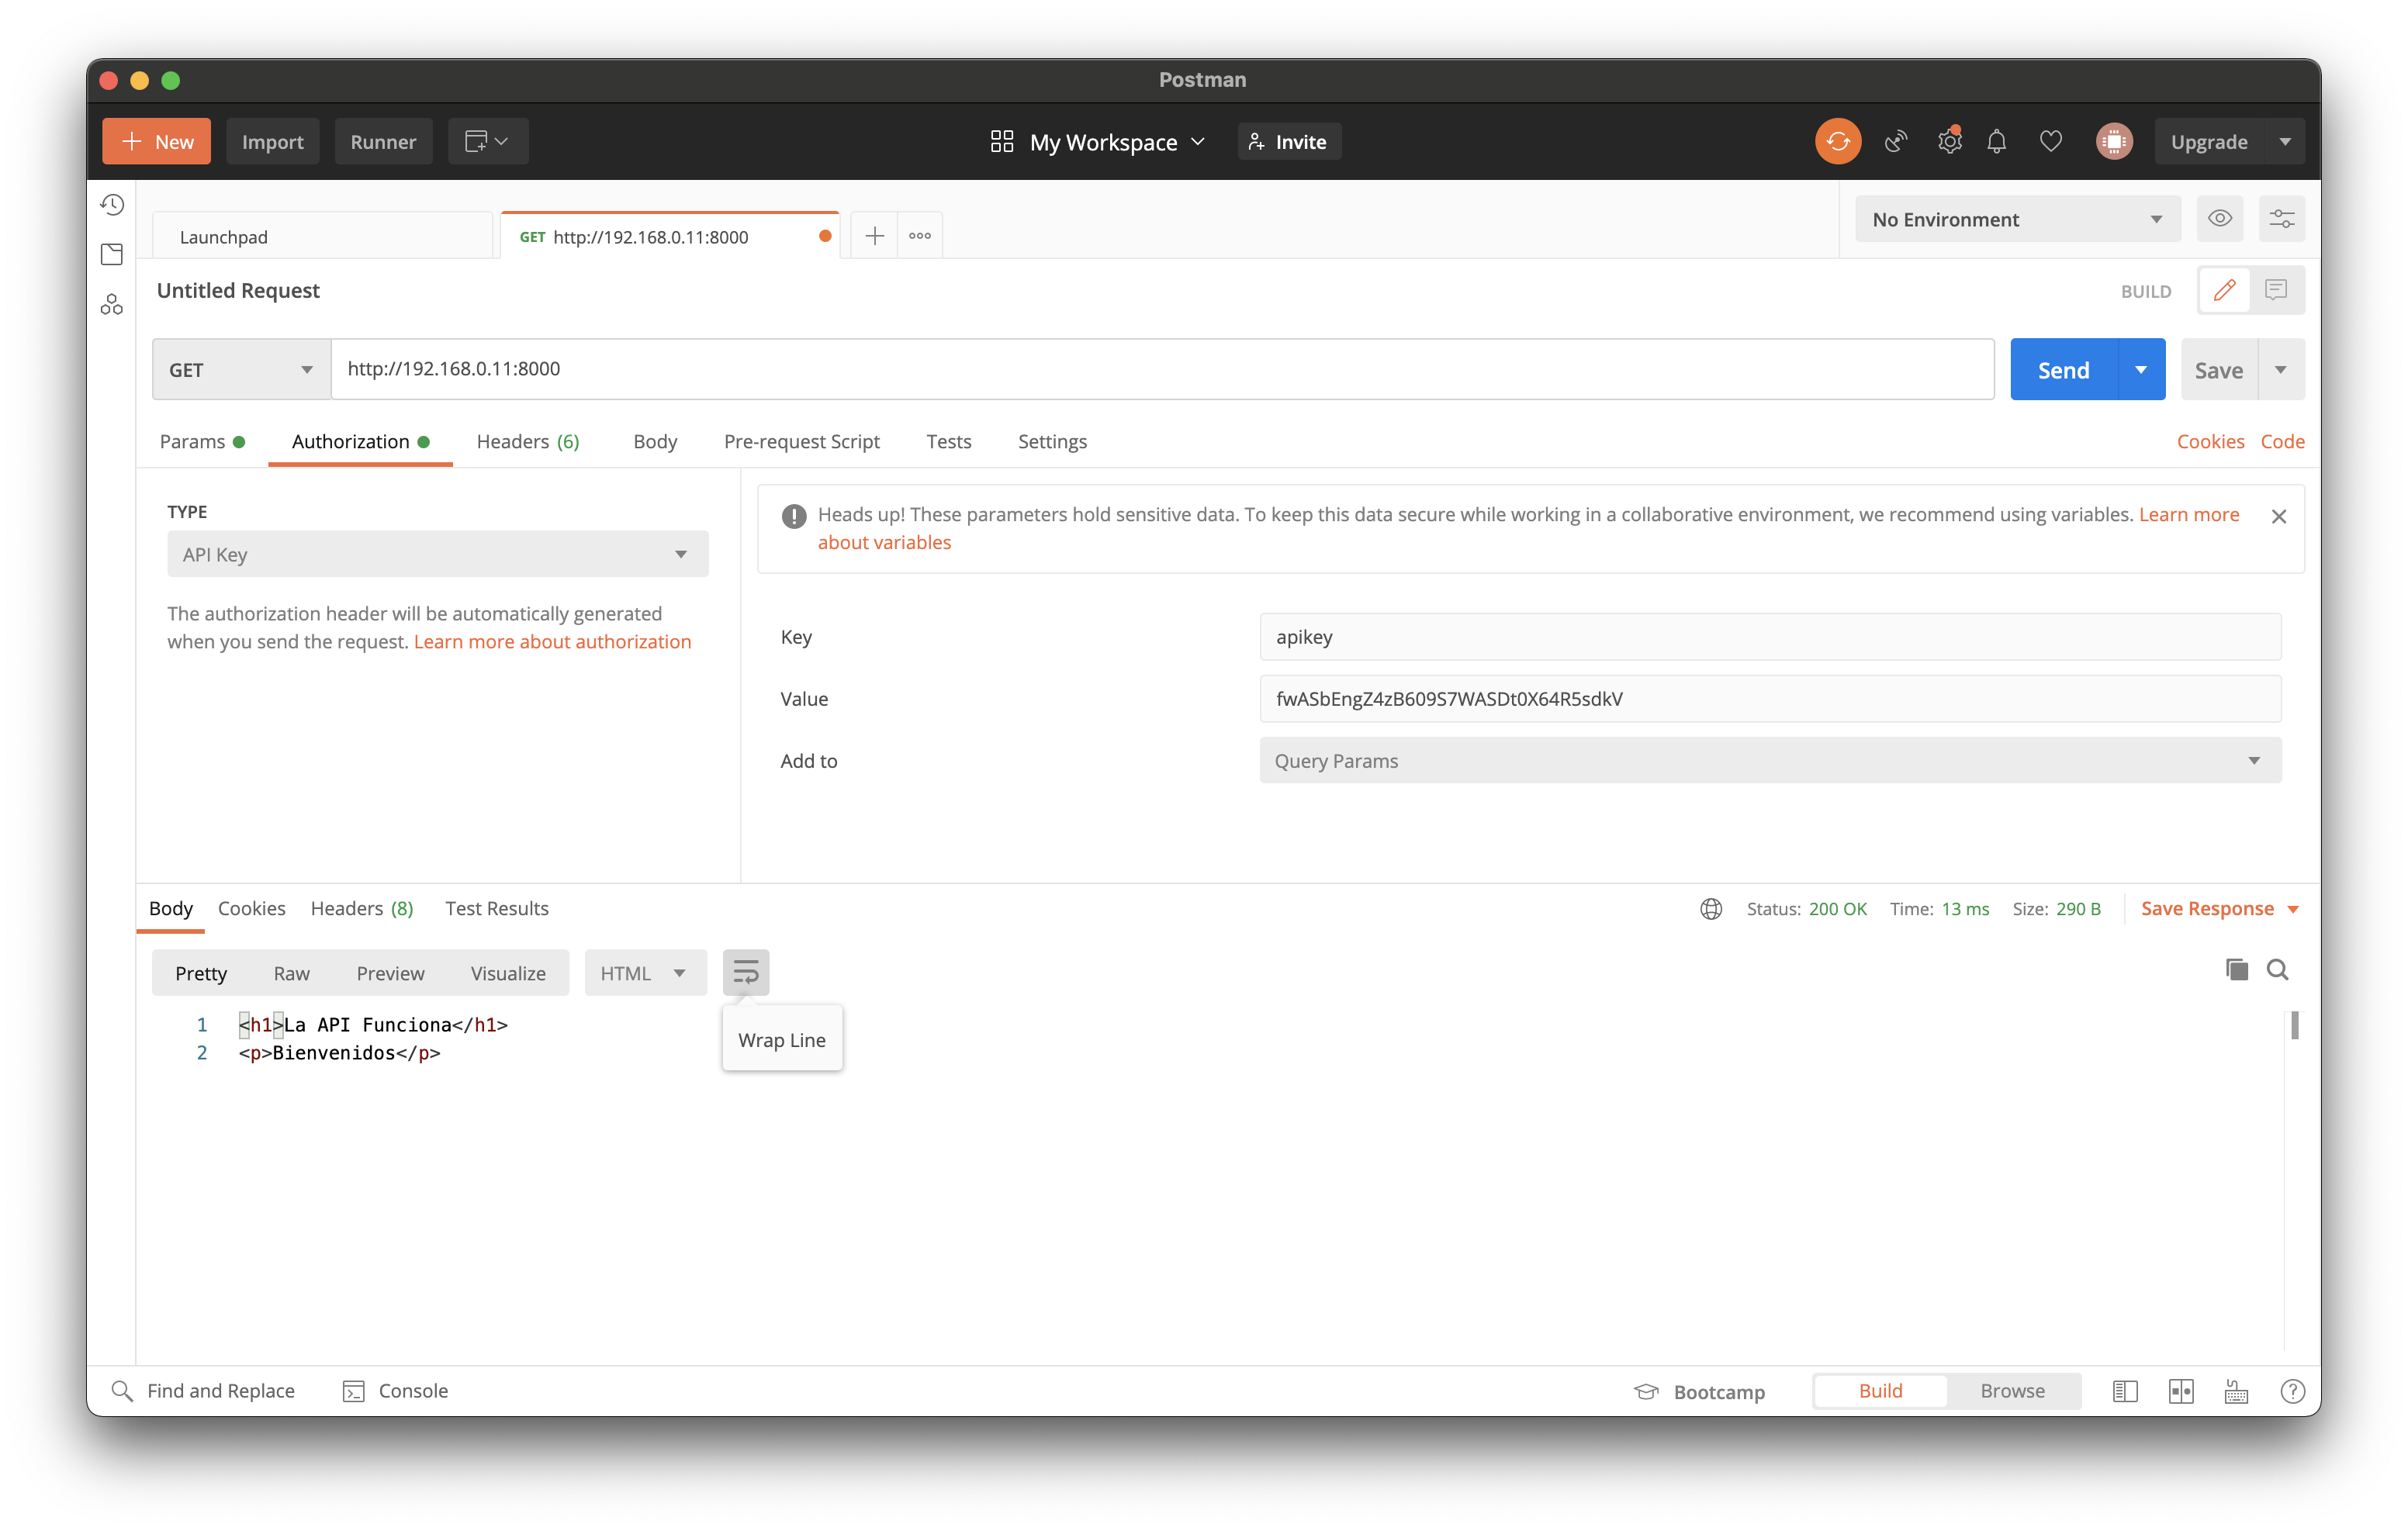
Try with Postman or Command Line.
curl -X GET
'http://localhost:8000'
-H 'apikey: fwASbEngZ4zB609S7WASDt0X64R5sdkV'
Graylog
Enter on http://localhost:9000 with Username: admin and Password: admin
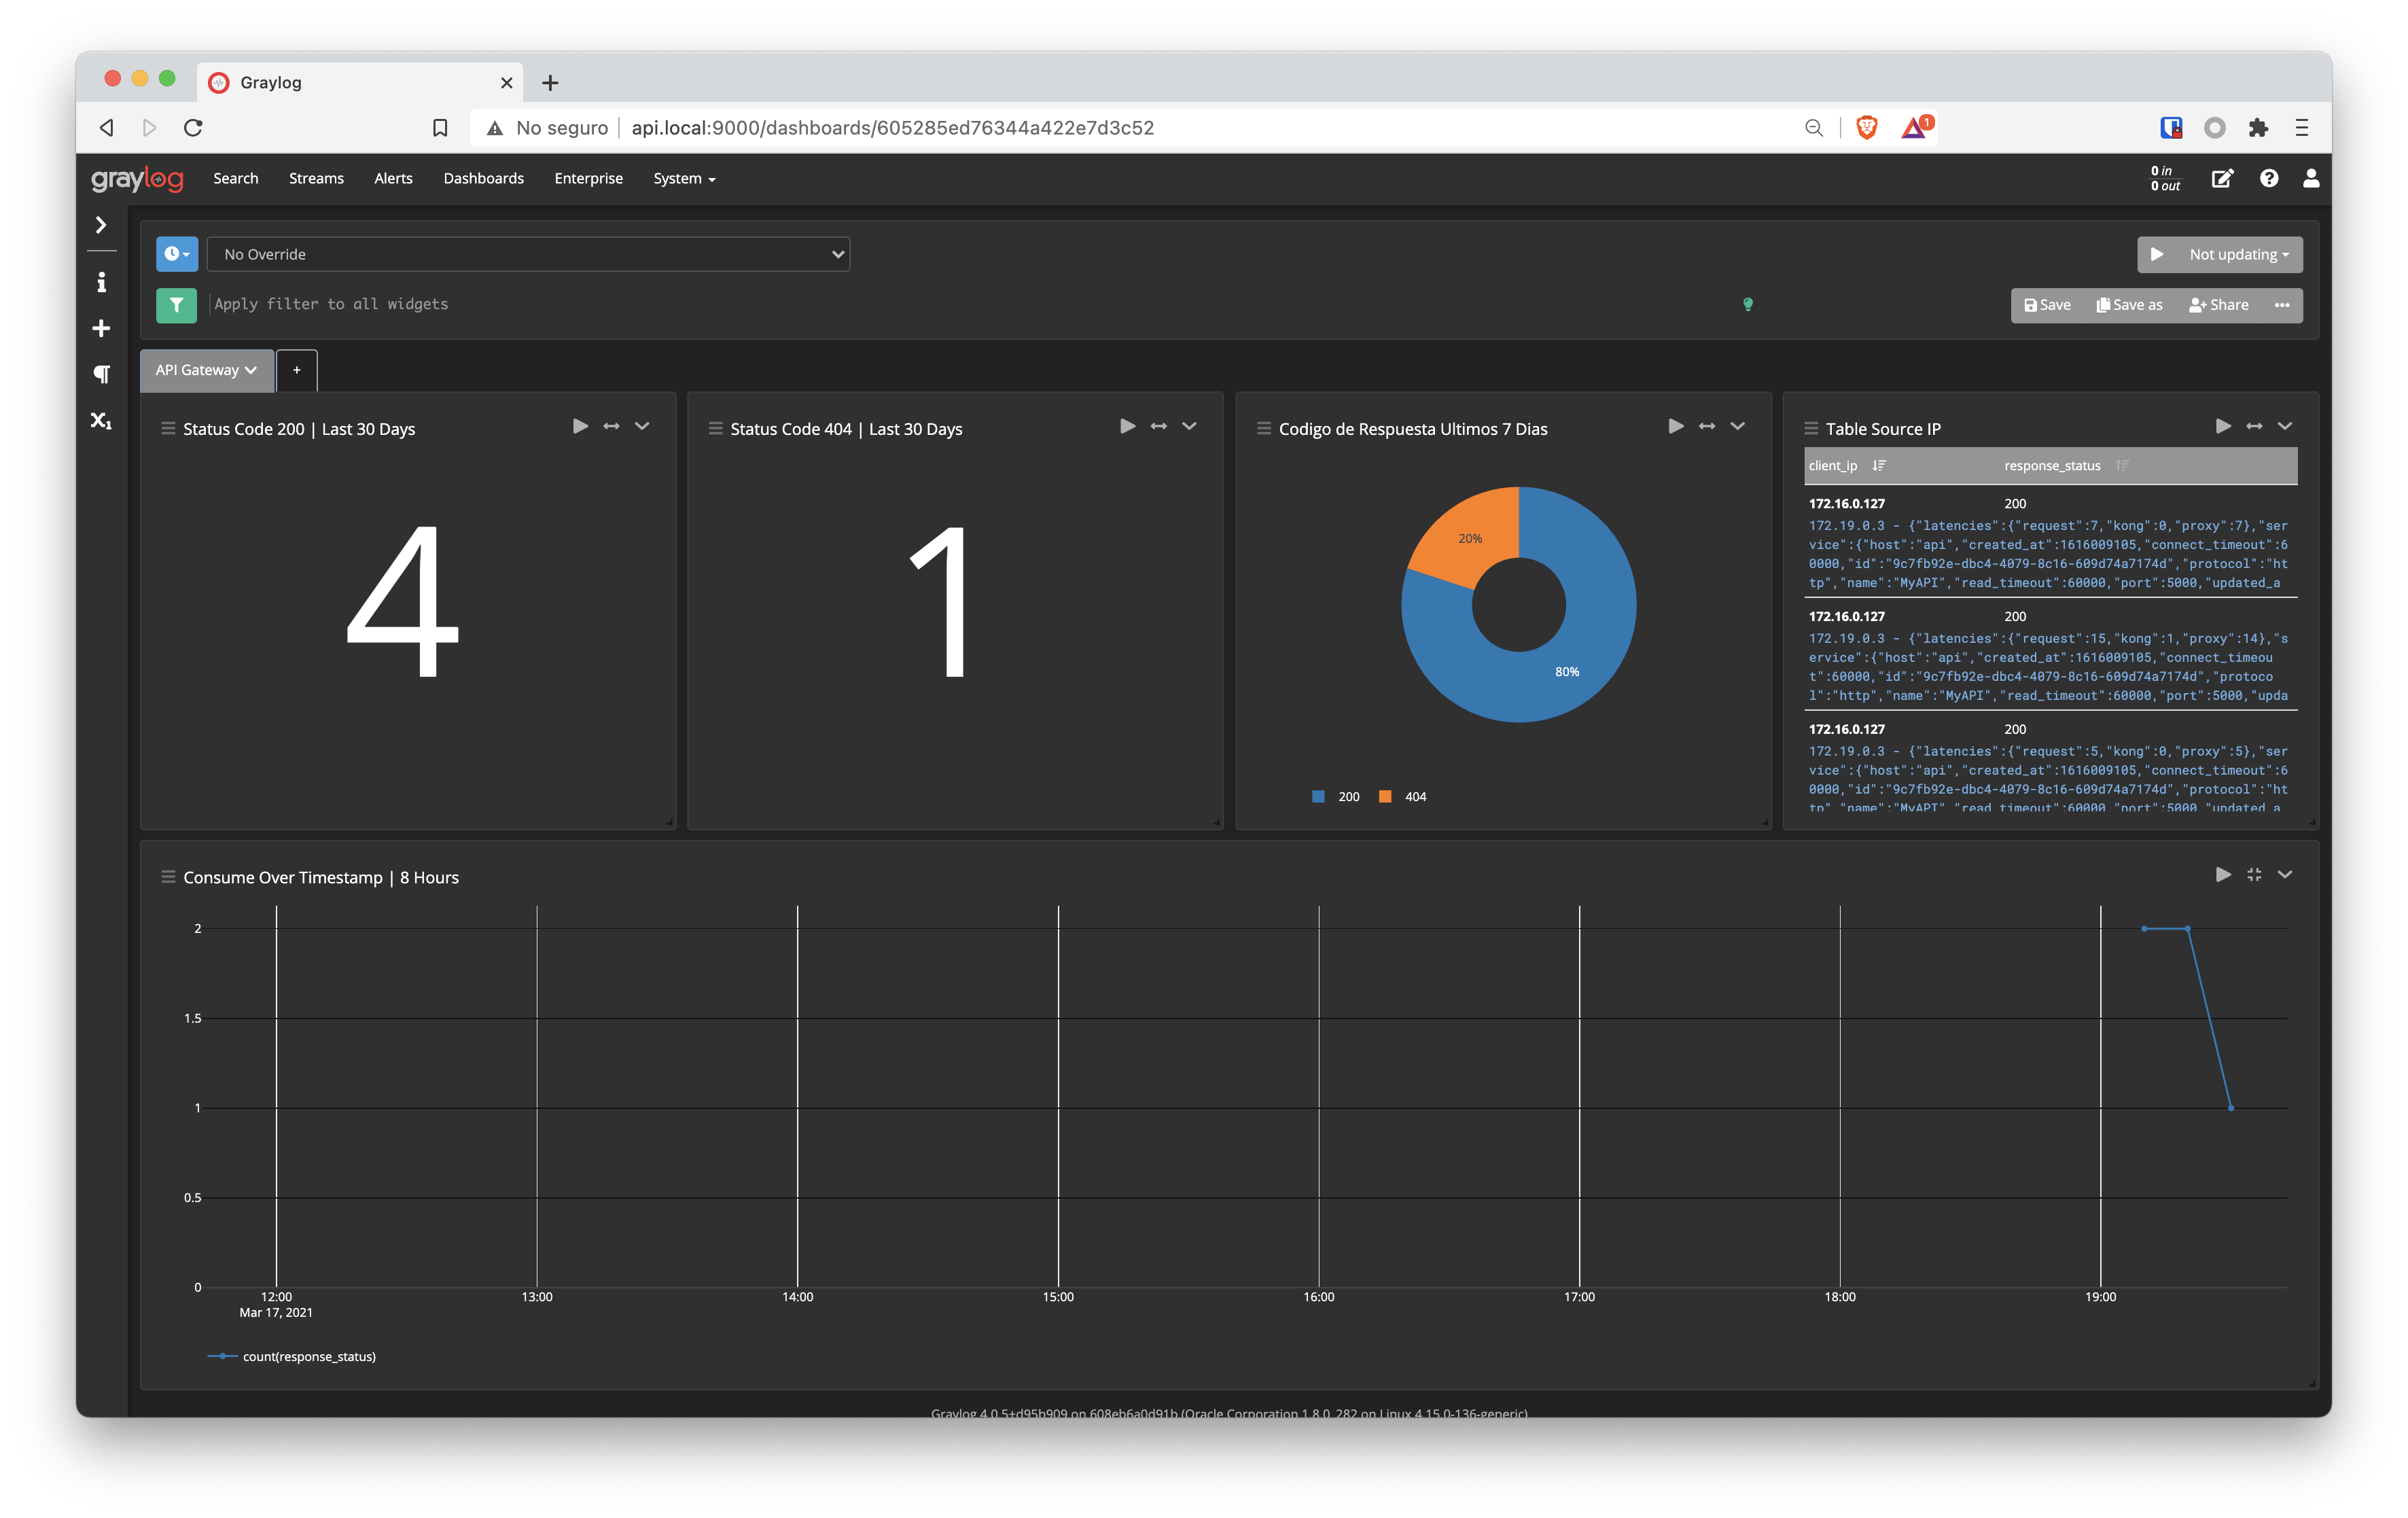
Create the Data Input on port 1514 to receive the Kong's logs. I create a panel, to visualize some data. You can create yours.
In the proyecto you have the dashboard to import.
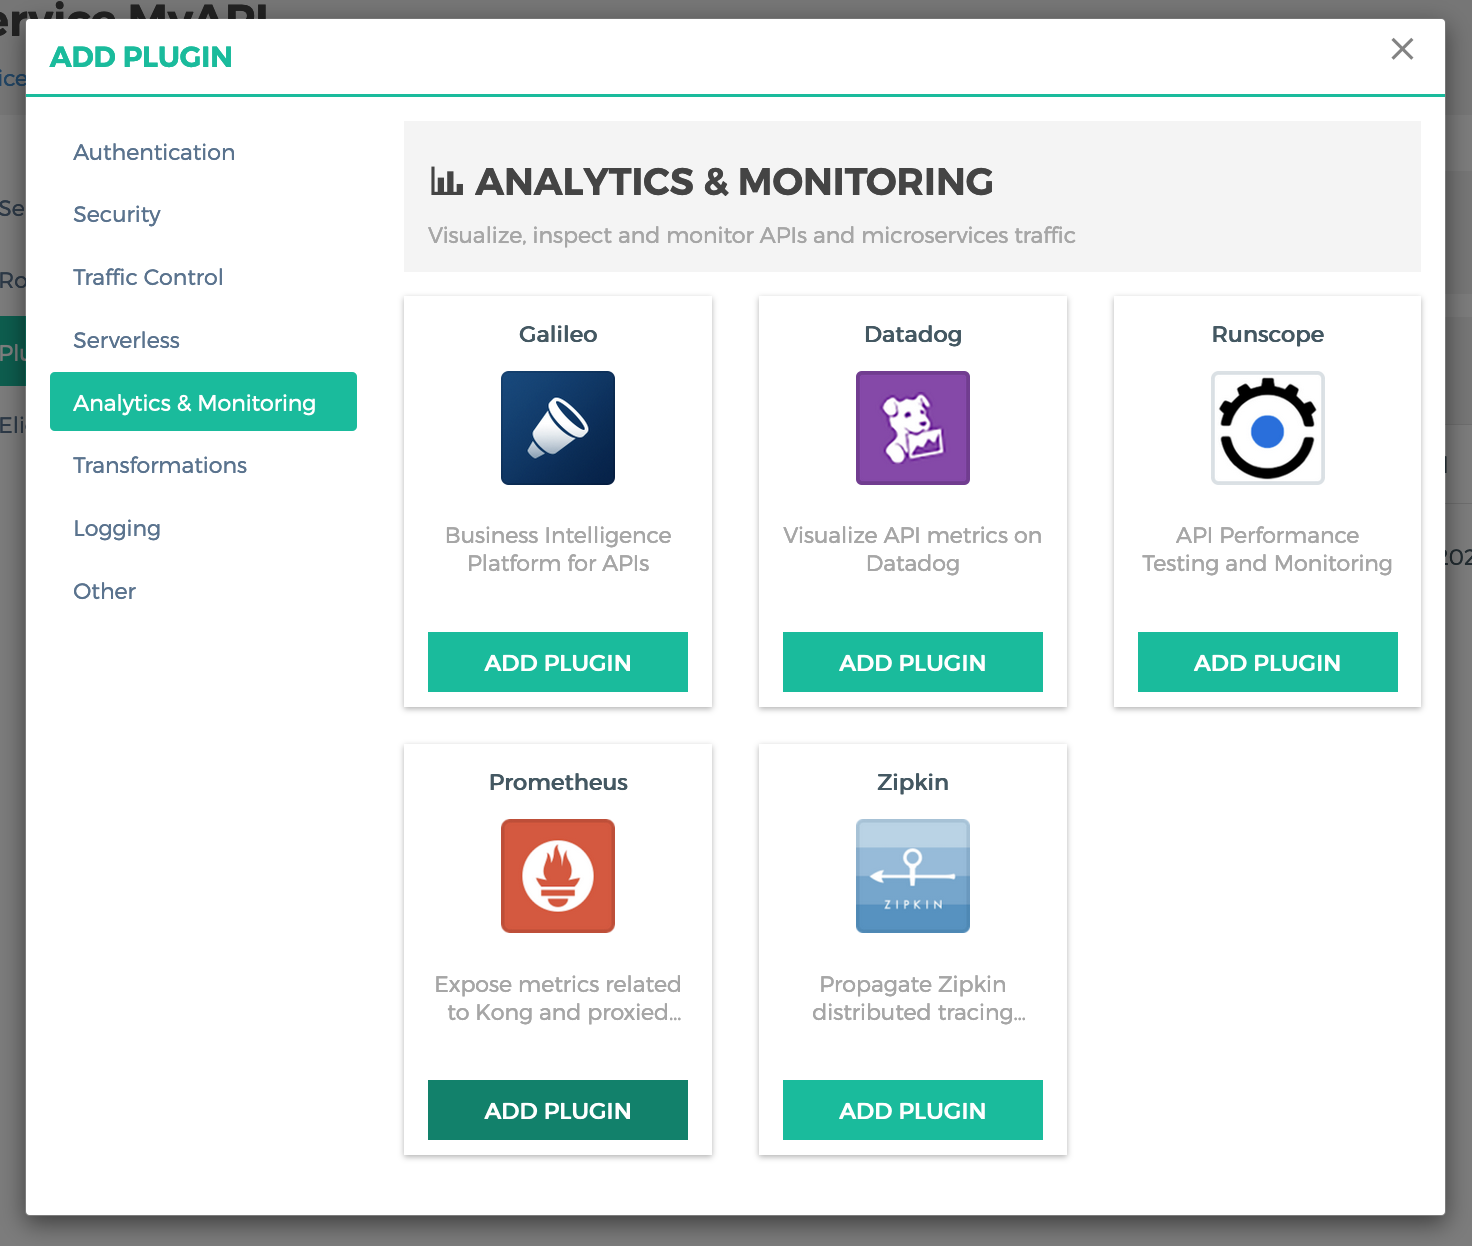
You can post the Plugin on Kong with:
curl -X POST http://localhost:8001/services/MyAPI/plugins --data "name=tcp-log" --data "config.host=NAMECONTAINERSPLUNK" --data "config.port=1514"
Prometheus + Grafana
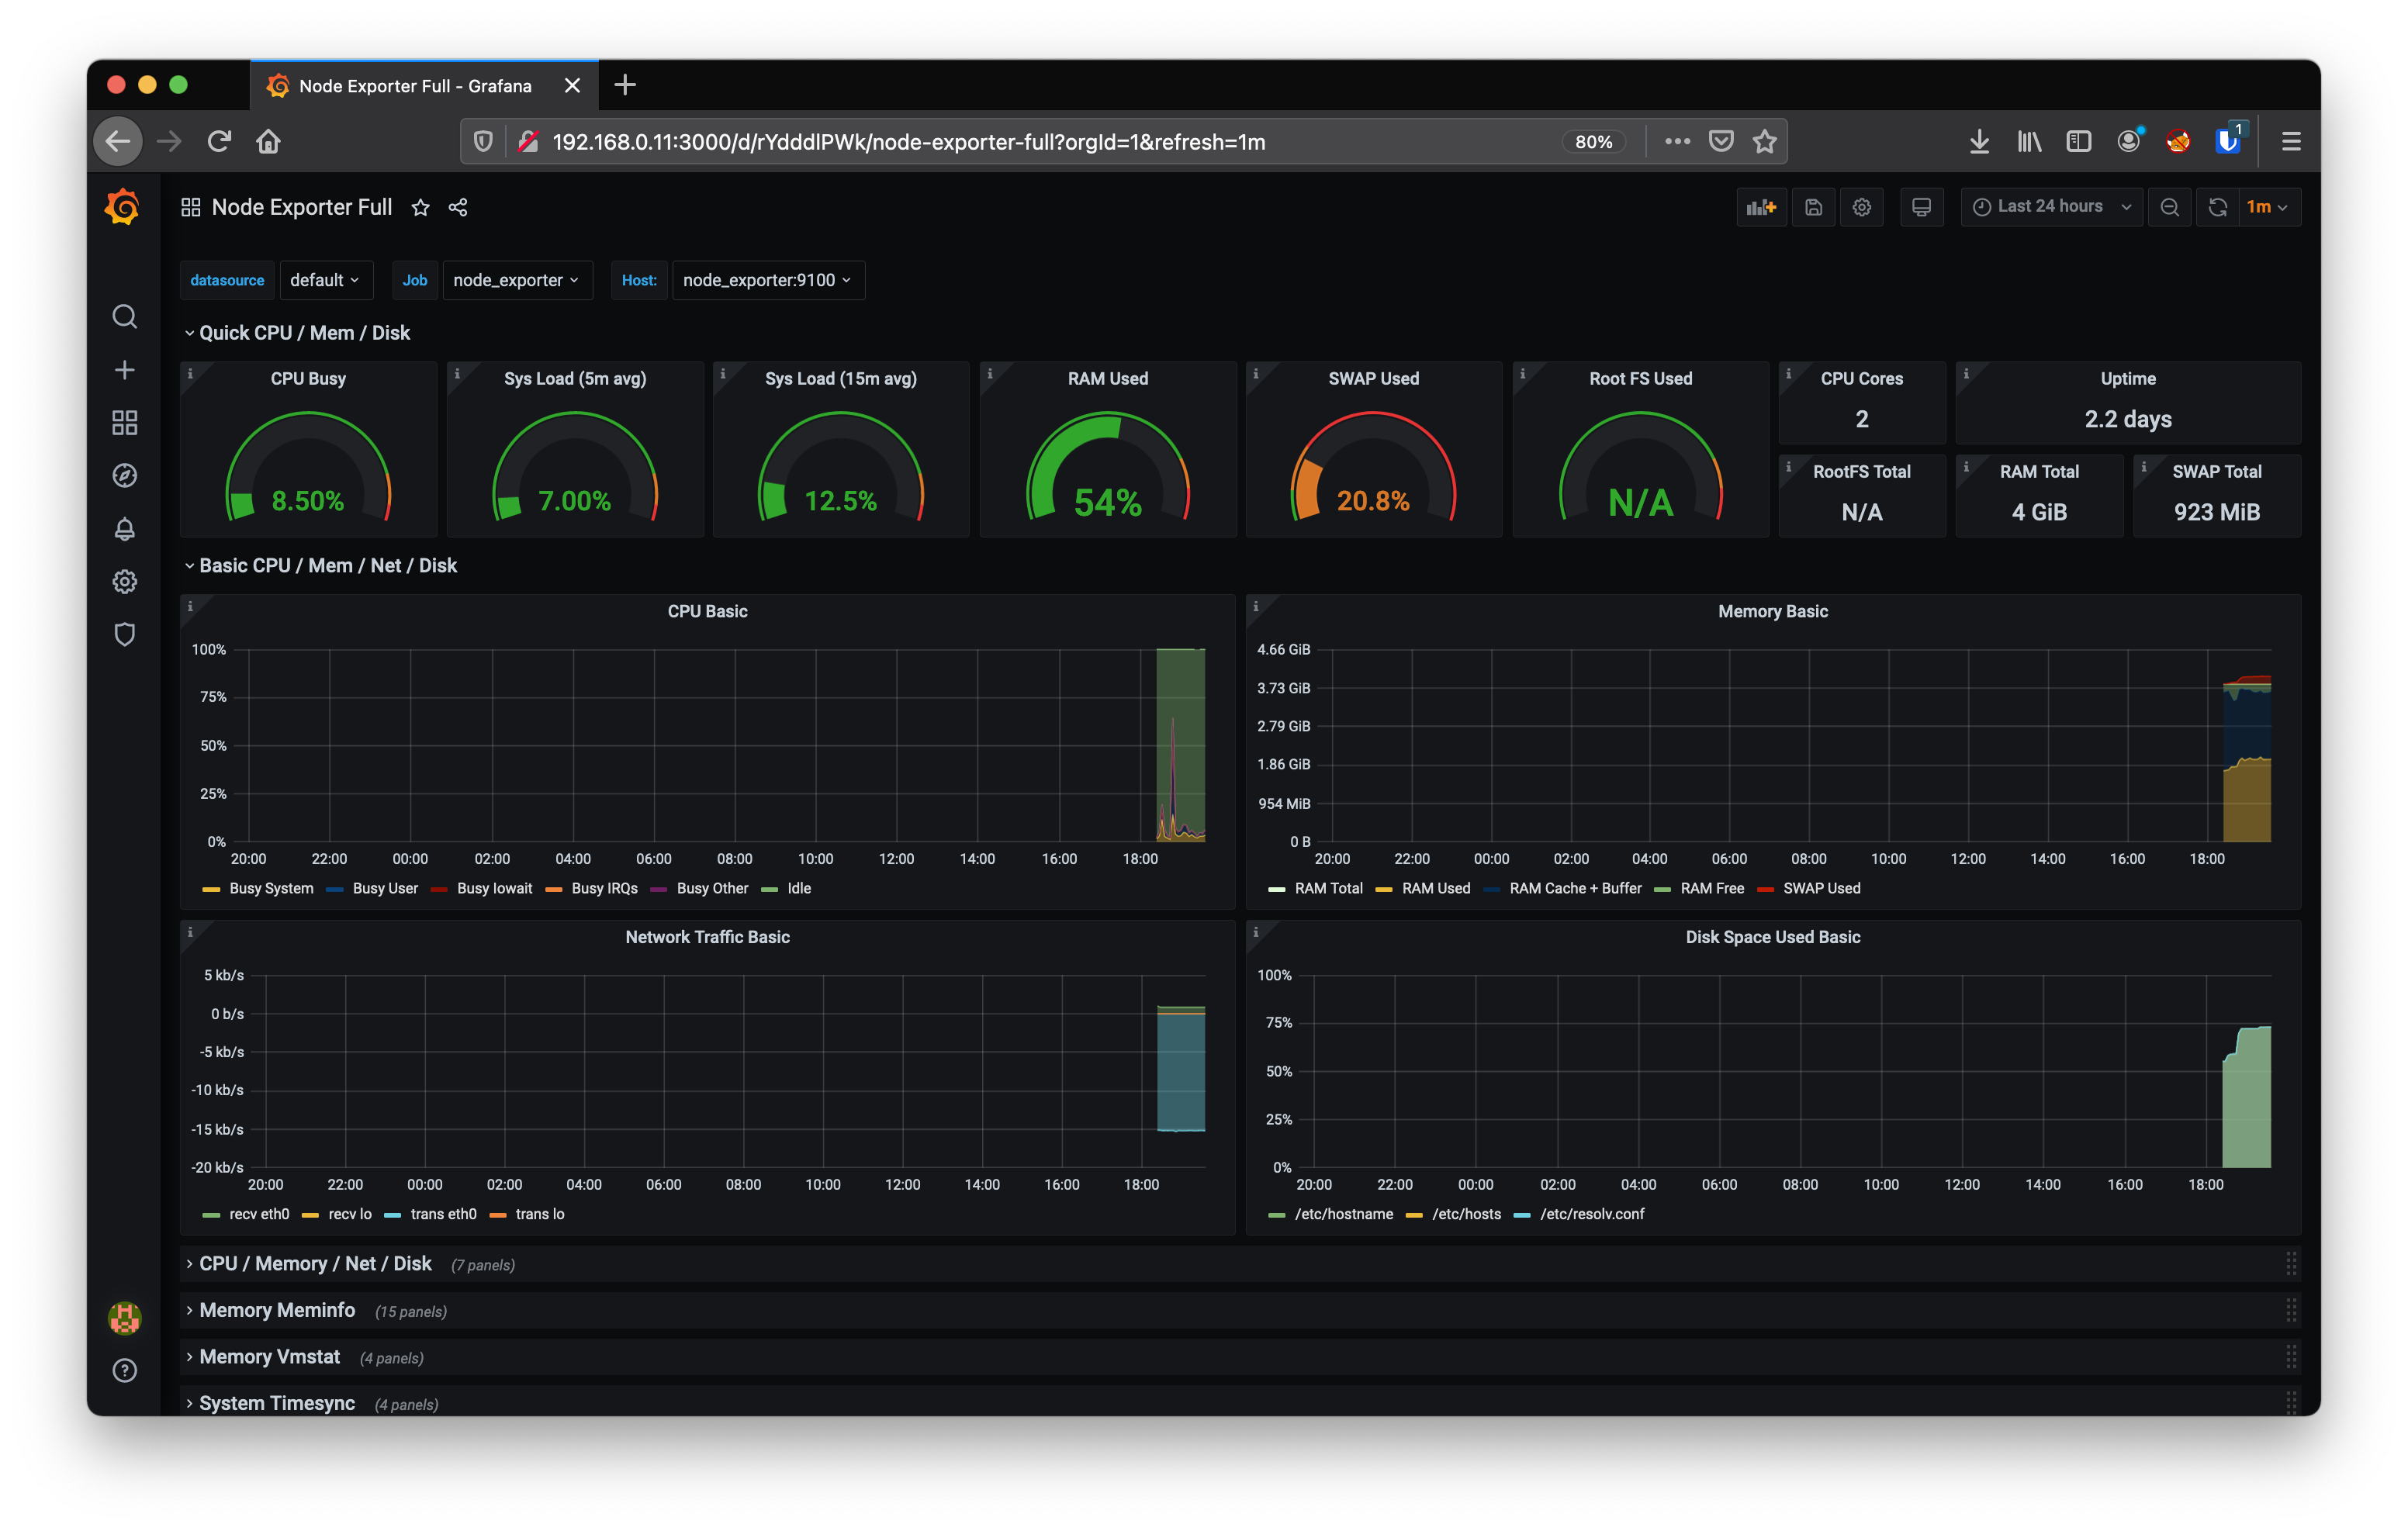
Prometheus to store the data and Grafana to visualize it. Add the plugin.
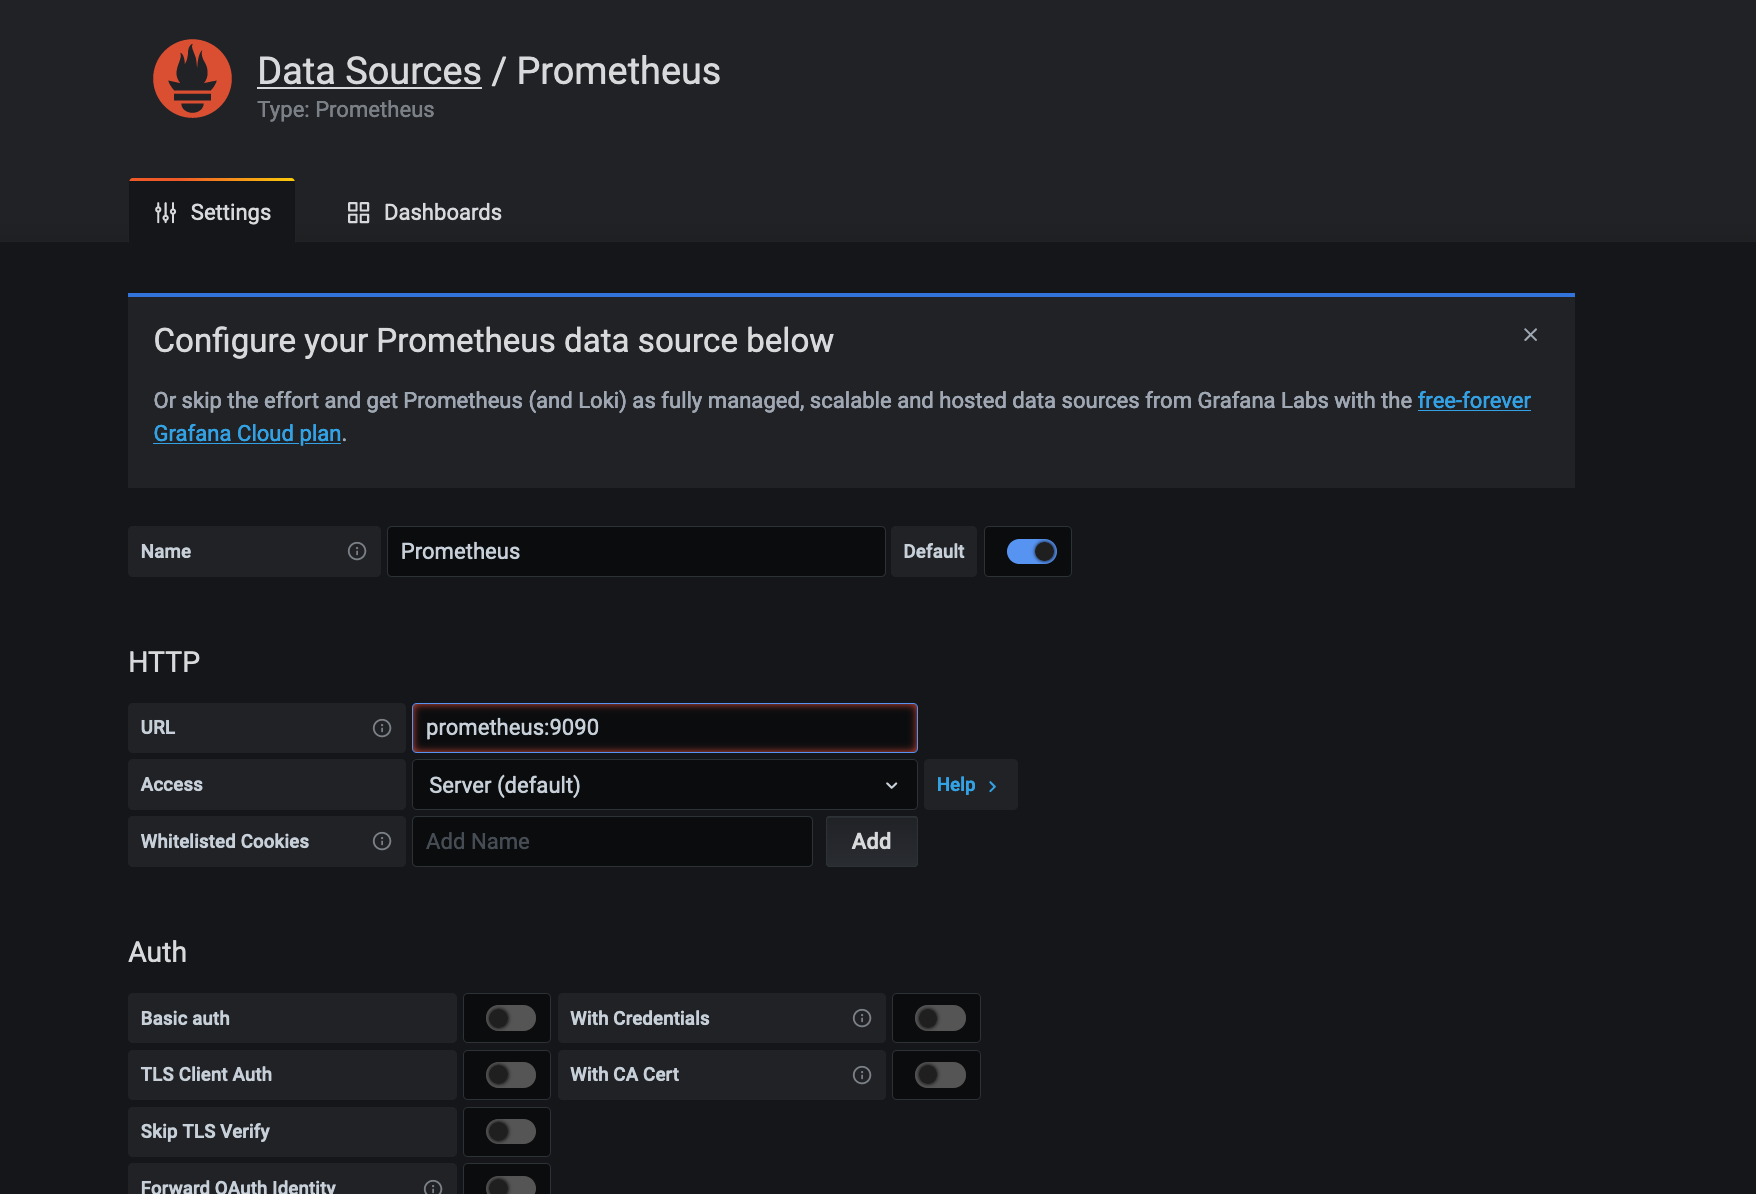
Ingress on Grafana on http://localhost:3000 with Username: admin and Password: admin. Import data from prometheus. The docker is prometheus on port 9090.
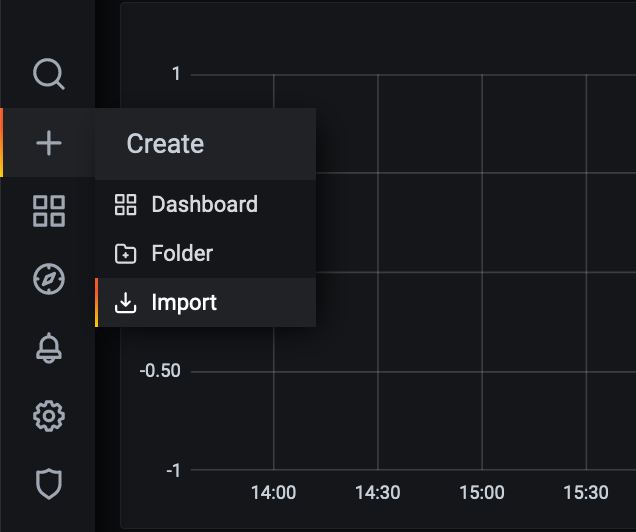
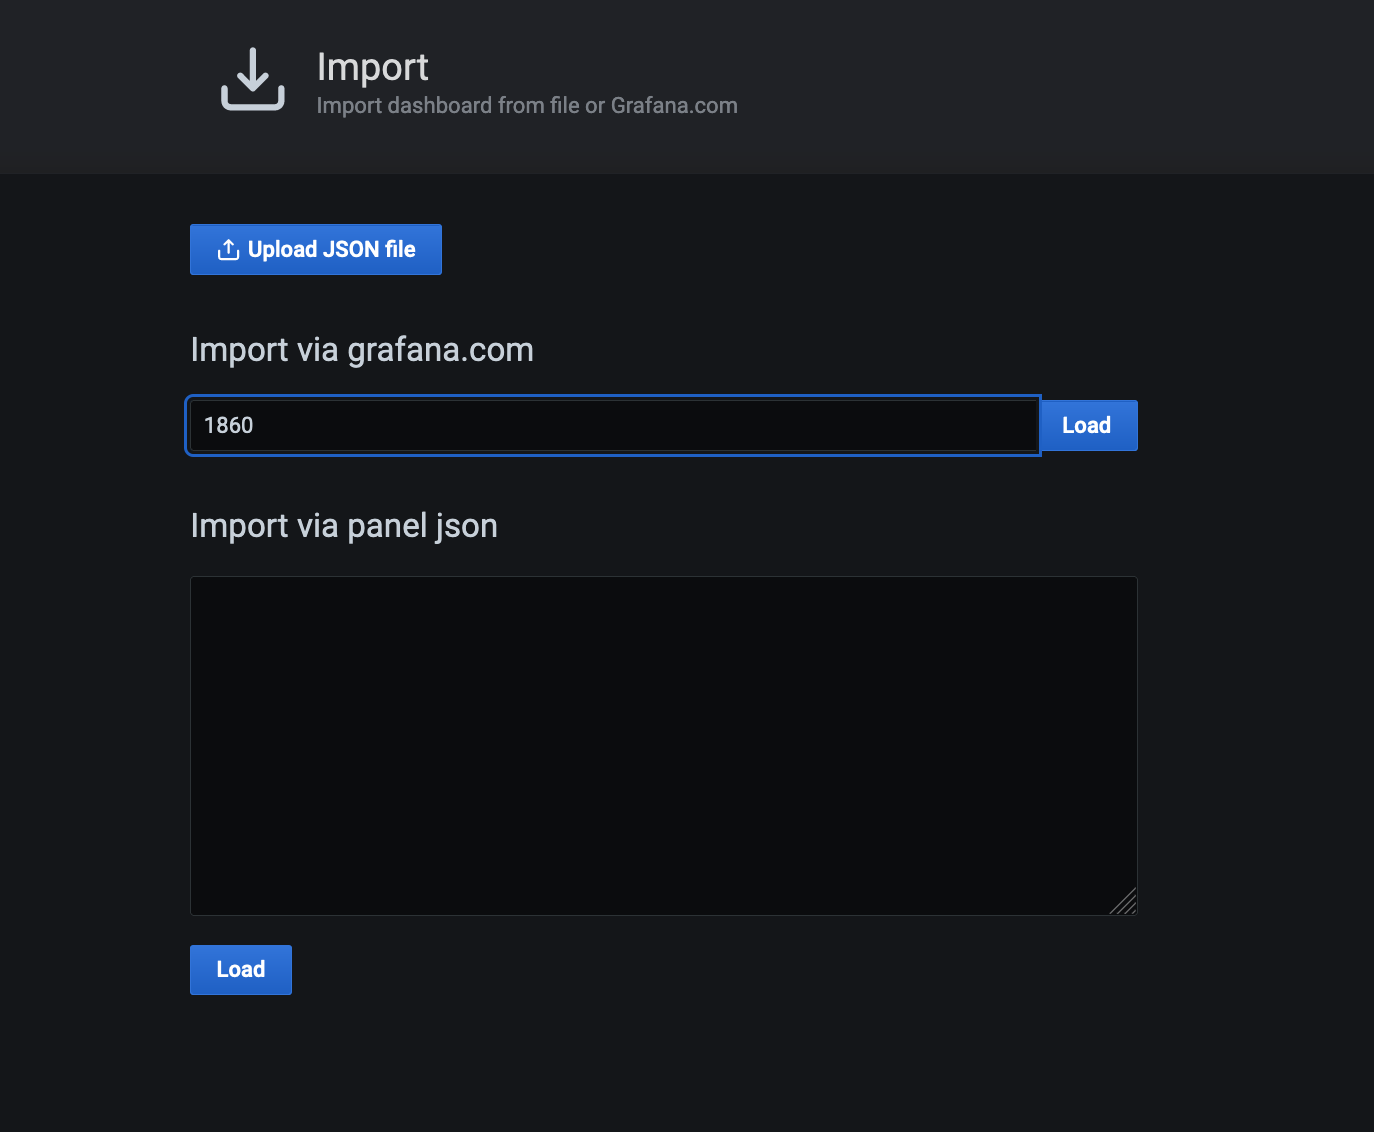
Import the Dashboard.
Load the JSON.
Enjoy the metrics.
Incident & Response
Enter on Graylog docker
docker exec -it -u 0 graylog /bin/bash
Copy I&R/update.sh to the container and run it. The u 0 its to log in like root.
Create the Alarm Rule with this parameters.
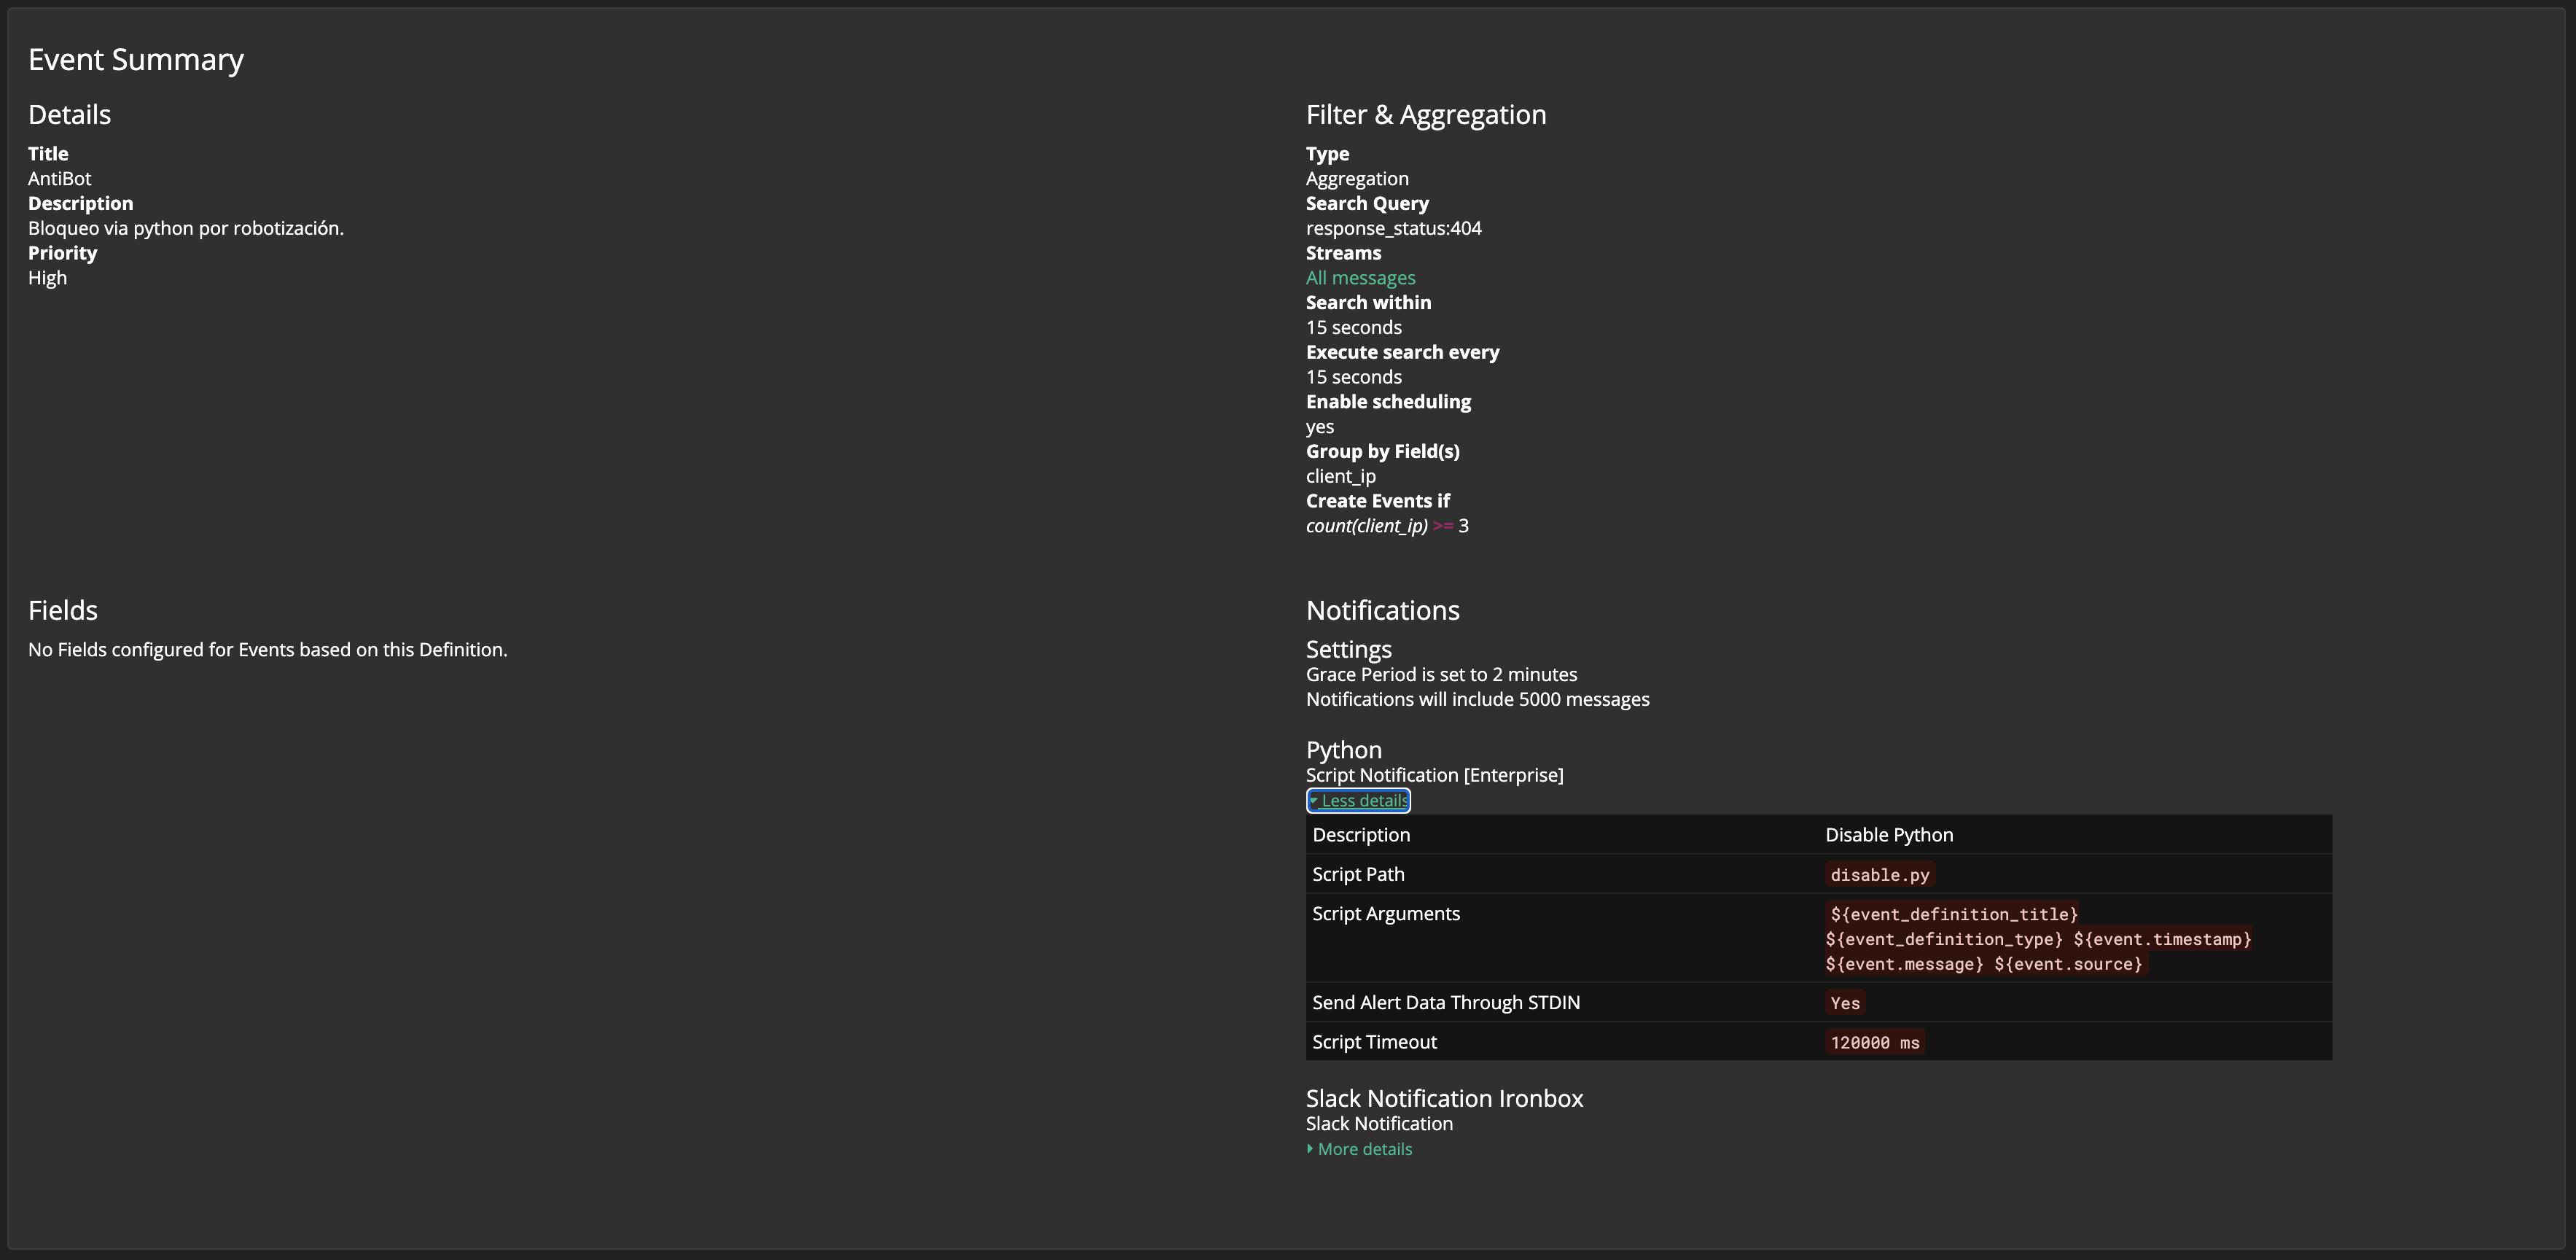
It is important that the script timeout is longer than the disable.py lock time.
🎯 Don't forget to create an Enterprise License for Graylog. If don't create it, the scripting don't run.
:star2: If you like the repo, please leave me a Star! :star2: