
============= peartree 🍐🌳
.. image:: https://img.shields.io/gitter/room/nwjs/nw.js.svg :target: https://gitter.im/peartree_transit

.. image:: https://img.shields.io/pypi/v/peartree.svg :target: https://pypi.python.org/pypi/peartree

.. image:: https://img.shields.io/travis/kuanb/peartree.svg?branch=master :target: https://travis-ci.org/kuanb/peartree

.. image:: https://codecov.io/gh/kuanb/peartree/branch/master/graph/badge.svg :target: https://codecov.io/gh/kuanb/peartree

peartree is a library for converting GTFS <https://developers.google.com/transit/gtfs/>_ feed schedules into a representative directed network graph. The tool uses Partridge <https://github.com/remix/partridge>__ to convert the target operator schedule data into Pandas <https://github.com/pandas-dev/pandas>__ dataframes and then NetworkX <https://networkx.github.io/>_ to hold the manipulated schedule data as a directed multigraph.
.. image:: https://raw.githubusercontent.com/kuanb/peartree/master/examples/example.gif
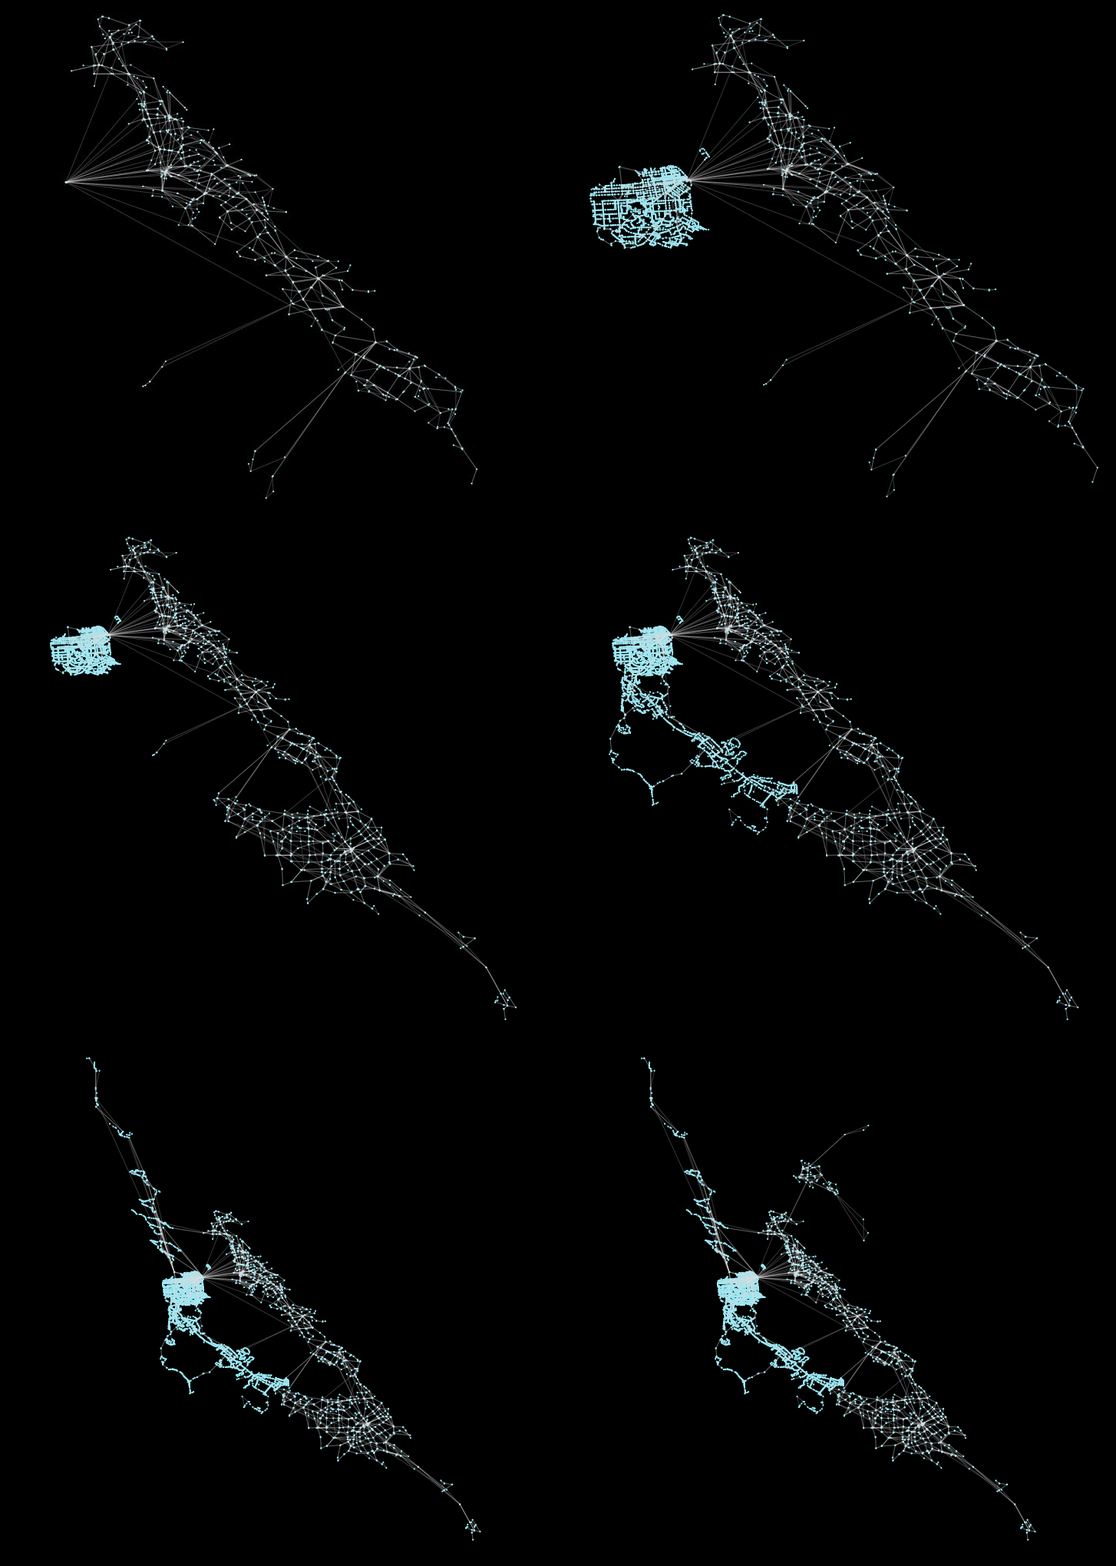
Above, an example of multiple Bay Area transit operators being incrementally loaded into peartree.
Installation
.. code:: console
pip install peartree
Usage
See a full notebook at this gist <https://gist.github.com/kuanb/c54d0ae7ee353cac3d56371d3491cf56>_ to see a simple, step-by-step iPython Notebook pulling in an AC Transit GTFS feed and converting it to a NetworkX graph.
.. code:: python
import peartree as pt

path = 'path/to/actransit_gtfs.zip'

# Automatically identify the busiest day and
# read that in as a Partidge feed
feed = pt.get_representative_feed(path)

# Set a target time period to
# use to summarize impedance
start = 7*60*60  # 7:00 AM
end = 10*60*60  # 10:00 AM

# Converts feed subset into a directed
# network multigraph
G = pt.load_feed_as_graph(feed, start, end)
Examples
I've yet to produce a full how-to guide for this library, but will begin to populate this section with any blog posts or notebooks that I or others produce, that include workflows using peartree.
Calculating betweeness centrality with Brooklyn bus network <http://kuanbutts.com/2017/12/13/betweenness-centrality-peartree/>_
Combining a peartree transit network and an OpenStreetMap walk network <http://kuanbutts.com/2018/12/24/peartree-with-walk-network/>_
Generating comparative acyclic route graphs <http://kuanbutts.com/2018/03/15/comparative-routes-mpl/>_
Coalescing transit network graphs and spectral clustering methods <http://kuanbutts.com/2018/04/01/spectral-cluster-transit/>_
Exploratory graph analysis with betweenness and load centrality <http://simplistic.me/playing-with-gtfs-iii-geo-graphs.html>_