

rootly-graphify
Built on graphify, a tool inspired by Andrej Karpathy's LLM Wiki idea — instead of rediscovering knowledge from scratch on every query, have an LLM build a persistent, structured knowledge graph that grows richer over time. Graphify takes any folder of files and turns it into a queryable graph with communities, connections, and confidence scores. This fork points it at the Rootly API.
Connect the Rootly API, collect incidents, alerts, teams, and the service catalog for a selected time window, export them into a local corpus, and turn that corpus into a queryable knowledge graph. Use graphify rootly for collection and /graphify in Claude Code or Codex when you want deeper semantic analysis on top.
Install
Fresh install (Graphify + Rootly importer):
pip install "graphifyy[rootly]"
graphify install            # Claude Code
graphify install --platform codex  # Codex
Add Rootly importer to an existing Graphify setup:
pip install "graphifyy[rootly]" --upgrade
Set your Rootly API key
Create a .env file in your project root:
ROOTLY_API_KEY=rootly_...
Run the workflow
Step 1: Fetch and build (terminal)
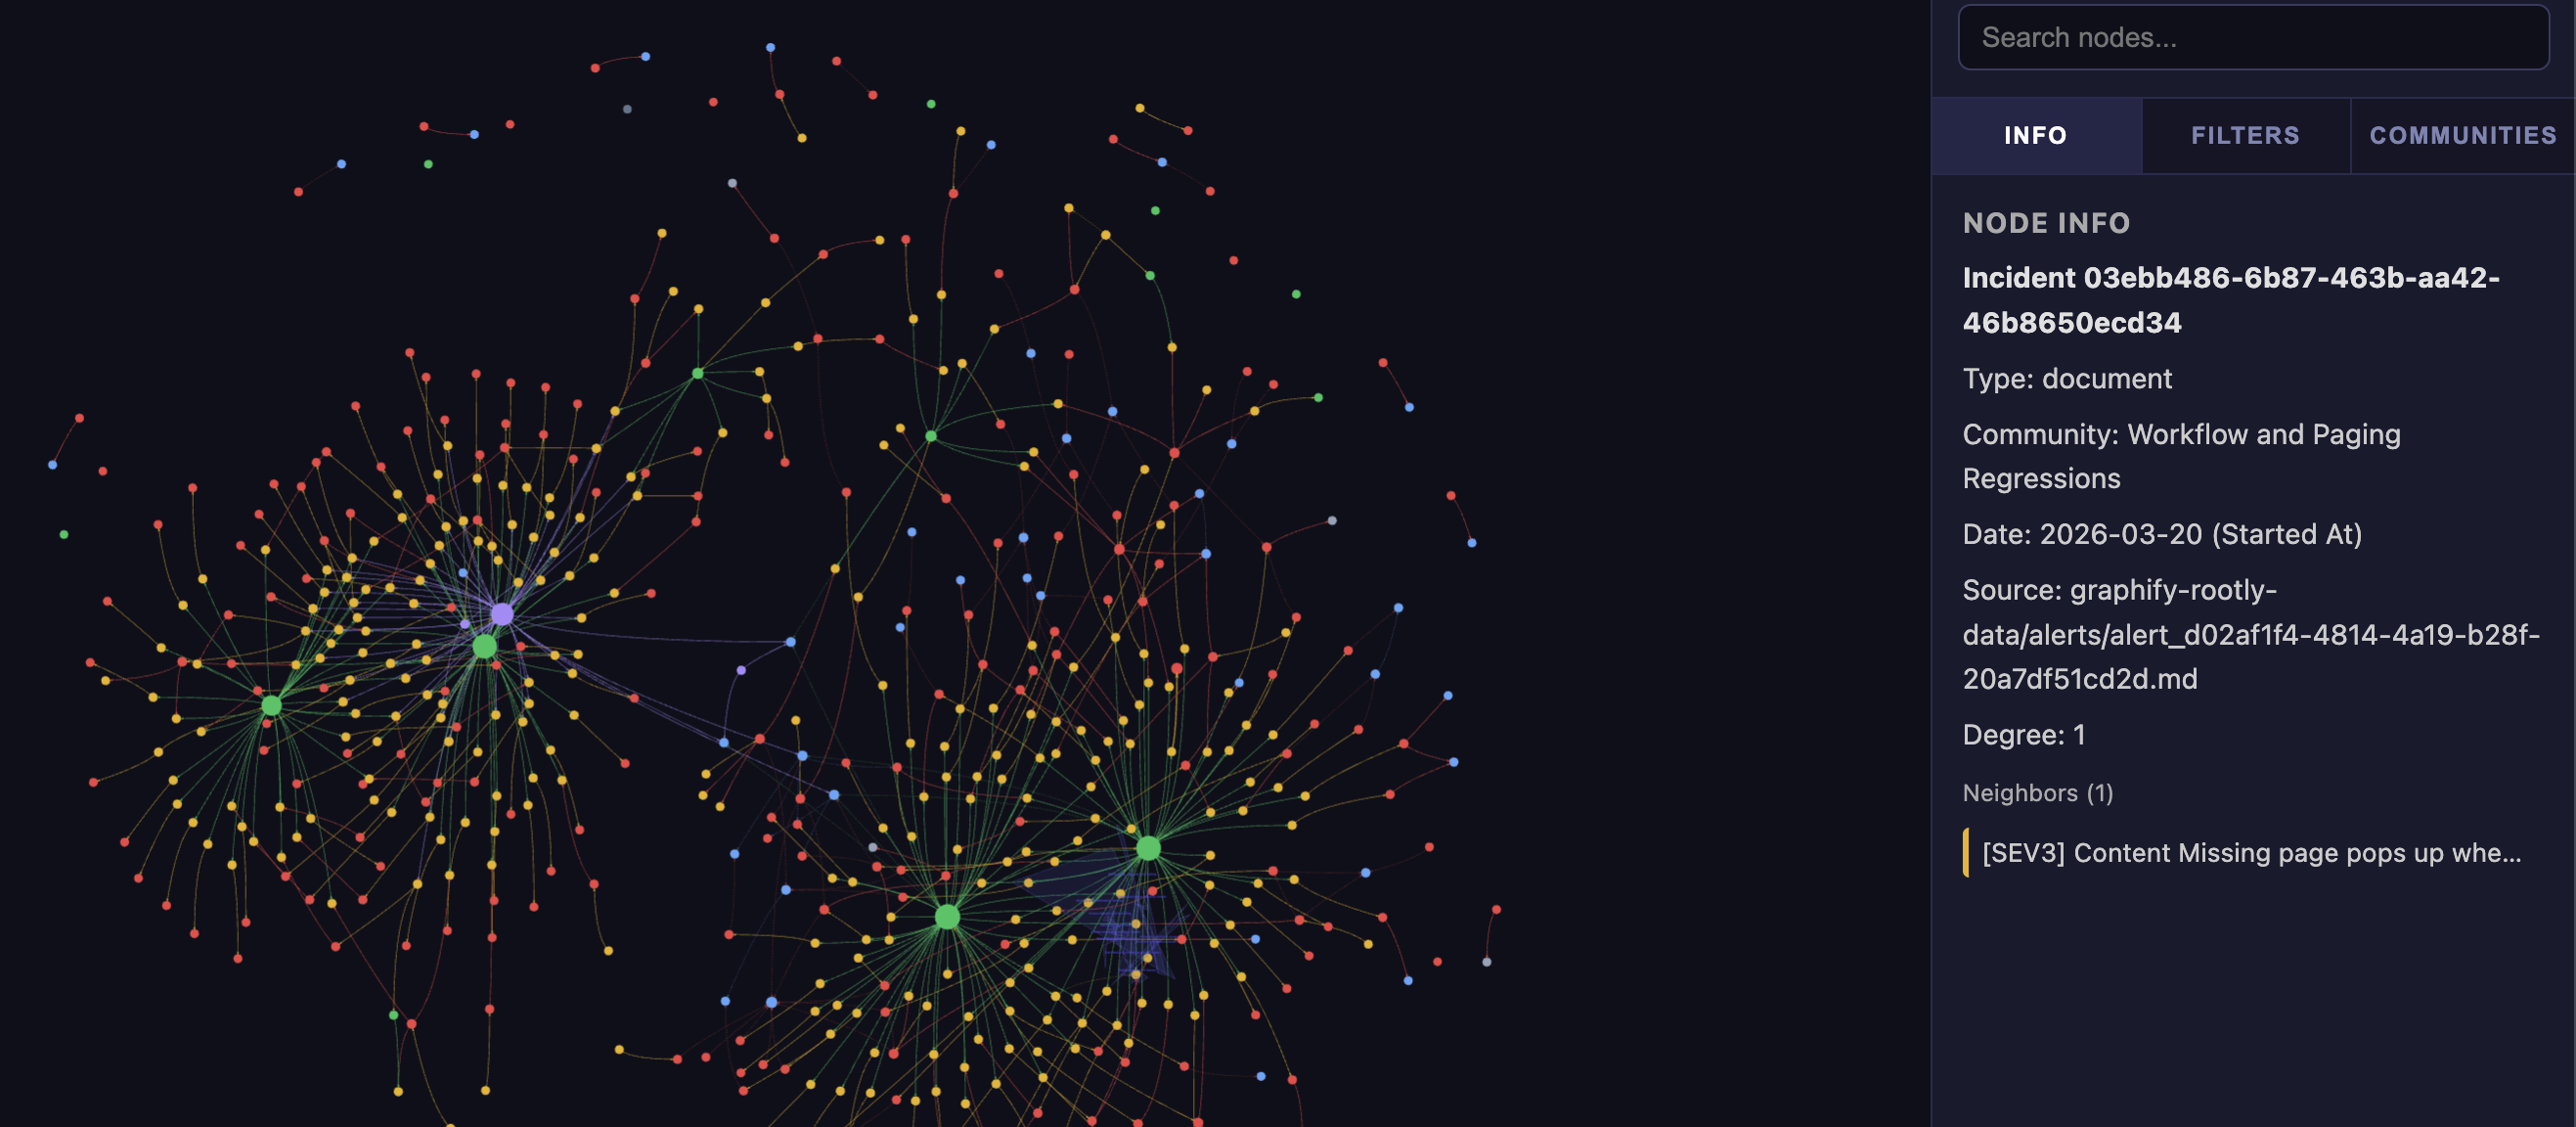
Fetches incidents, triggered alerts, and teams. Builds the initial graph with severity colors, alert filters, and team/service layers.
graphify rootly
Non-interactive:
graphify rootly --api-key-env ROOTLY_API_KEY --days 30 --mode standard
Outputs written to graphify-rootly-data/graphify-out/:
graph.html— open in browser to explore the graphGRAPH_REPORT.md— god nodes, communities, suggested questionsgraph.json— raw graph for querying
Step 2: Add semantic meaning (agent)
Runs parallel subagents over the incident corpus to infer cross-incident themes, recurring patterns, and root cause relationships.
Claude Code — type in the chat:
/graphify graphify-rootly-data --mode deep
Codex — type in the chat:
run graphify on graphify-rootly-data --mode deep
What you can explore
| Pattern | What it shows | Why a graph helps |
|---|---|---|
| Service incident heatmap | Which services are on fire and how badly. Node size = incident count, color = worst severity. | Clusters services that tend to fail together, revealing hidden infrastructure dependencies. |
| Team on-call & escalation map | Who covers what across all schedules and escalation policies in one view. | Spots single points of failure — the person on 4 schedules across 3 teams — and coverage gaps. |
| Alert-to-incident funnel | Which alert sources produce real incidents vs. pure noise. | An alert source with 200 alerts and 0 incidents is immediately visible by node size. |
| Incident → action item follow-through | Are we actually fixing what breaks? Solid edges = completed, dashed = open. | Clusters of open action items around a team or service expose systematic follow-through problems. |
| Cross-service failure correlation | Which services fail together within the same time window. | Community detection finds shared-fate groups that likely depend on the same underlying infrastructure. |
What gets collected
| Resource | What | Filter |
|---|---|---|
| Incidents | Title, severity, status, timeline, services, teams, description | Date window (--days) |
| Alerts | Summary, status, source, noise flag, timeline | Triggered only (linked to an incident) |
| Teams | Name, slug, service ownership | All teams in account |
Visualization filters
Once graph.html is open in a browser:
- Team — filter all nodes to a specific team's incidents and services
- Severity — show/hide by SEV1–SEV4
- Incidents — all or open only
- Alerts — triggered (on by default) / orphaned (off by default, not collected)
- Time range — slider to narrow the incident window
How it works
rootly-graphify has a Rootly collection phase and a graph analysis phase.
-
Deterministic Rootly collection. Validate the API key, choose a 7, 30, or 90 day window, fetch incidents whose
started_atfalls inside that window, fetch their triggered alerts via the per-incident sub-resource, fetch all team data, and write everything to a local corpus directory. -
Initial Rootly graph build. The built-in Rootly runner creates nodes for incidents, alerts, teams, and services, wires them together with typed edges (
triggered,affects,owns,responded_by,targets), clusters the graph, and writesgraph.html,GRAPH_REPORT.md, andgraph.json. The HTML includes severity color coding, team/service layers, and alert filters. -
Optional deep enrichment. Run
/graphify ./graphify-rootly-data --mode deepto dispatch parallel subagents over the markdown files and infer cross-incident themes, rationale, and conceptual links. -
Use the current top-level output. After semantic enrichment, open
graphify-out/graph.html. The current generic exporter already includes the maintained filters and visuals directly, so no separate re-apply step is required.
Clustering is graph-topology-based — no embeddings. Leiden finds communities by edge density. Semantic similarity edges (semantically_similar_to, marked INFERRED) influence community detection directly. No separate embedding step or vector database required.
Every relationship is tagged EXTRACTED (found directly in source), INFERRED (reasonable inference, with a confidence score), or AMBIGUOUS (flagged for review).
What you get
God nodes — highest-degree incidents or services (what everything connects through)
Surprising connections — cross-incident links ranked by composite score, each with a plain-English explanation
Suggested questions — 4–5 questions the graph is uniquely positioned to answer about your incident history
Confidence scores — every INFERRED edge has a confidence_score (0.0–1.0). EXTRACTED edges are always 1.0.
Semantic similarity edges — cross-incident conceptual links with no structural connection. Two incidents caused by the same root pattern without sharing services or teams.
Token efficiency — the first run extracts and builds the graph (costs tokens). Every subsequent query reads the compact graph instead of raw markdown — that's where the savings compound. SHA256 cache means re-runs only re-process changed files.
Usage
# --- Rootly workflow (terminal) ---
graphify rootly                                        # interactive Rootly import flow
graphify rootly --days 30                              # collect last 30 days of incidents
graphify rootly --api-key-env ROOTLY_API_KEY           # non-interactive key lookup from env
graphify rootly --output ./my-rootly-corpus            # write corpus to a custom folder

# --- Semantic enrichment (agent: Claude Code / Codex) ---
/graphify ./graphify-rootly-data                       # analyze the Rootly corpus
/graphify ./graphify-rootly-data --mode deep           # more aggressive INFERRED edges
/graphify ./graphify-rootly-data --update              # re-extract only changed files

# --- Query the graph (agent) ---
/graphify query "which services have the most recurring incidents?"
/graphify query "what patterns connect the SEV1 incidents?"
/graphify path "payment-api" "auth-service"
/graphify explain "Incident: Database connection pool exhausted"

# --- Optional exports ---
/graphify ./graphify-rootly-data --wiki                # agent-crawlable wiki per community
/graphify ./graphify-rootly-data --no-viz              # skip HTML, report + JSON only
/graphify ./graphify-rootly-data --obsidian            # Obsidian vault

# --- Always-on assistant instructions ---
graphify claude install                                # CLAUDE.md + PreToolUse hook (Claude Code)
graphify codex install                                 # AGENTS.md (Codex)
Re-run on new data
# Fetch fresh data and rebuild
graphify rootly --api-key-env ROOTLY_API_KEY --days 30 --mode standard

# Re-enrich with semantic step (Claude Code)
/graphify graphify-rootly-data --update