Home
Softono
tidytuesday

tidytuesday

Open source R
274
Stars
37
Forks
0
Issues
15
Watchers
1 week
Last Commit

About tidytuesday

This repository hosts the source code for visualizations created as part of TidyTuesday, a weekly social data project organized by the Data Science Learning Community. It contains scripts written in R, Python, D3, and Svelte that generate statistical graphics and interactive charts based on weekly open datasets. The code supports reproducibility and showcases diverse techniques for data storytelling. Beyond the raw scripts, the project includes a dedicated Shiny application that dynamically displays every visualization created. This interactive app allows users to search plots by the specific software packages used to build them, view the underlying code, and access original data sources. The platform updates automatically upon the creation of new projects, serving as a living portfolio of data exploration. It is designed for data scientists, analysts, and learners who wish to study practical implementation of data visualization libraries or find inspiration for their own analytical work.

Platforms

Web Self-hosted

Languages

R

TidyTuesday

TidyTuesday is a weekly social data project organised by the Data Science Learning Community. This repository contains the R, Python, SveltePlot, and D3 code used to produce my visualisations of TidyTuesday data. You can follow my attempts on LinkedIn, BlueSky, or Mastodon.

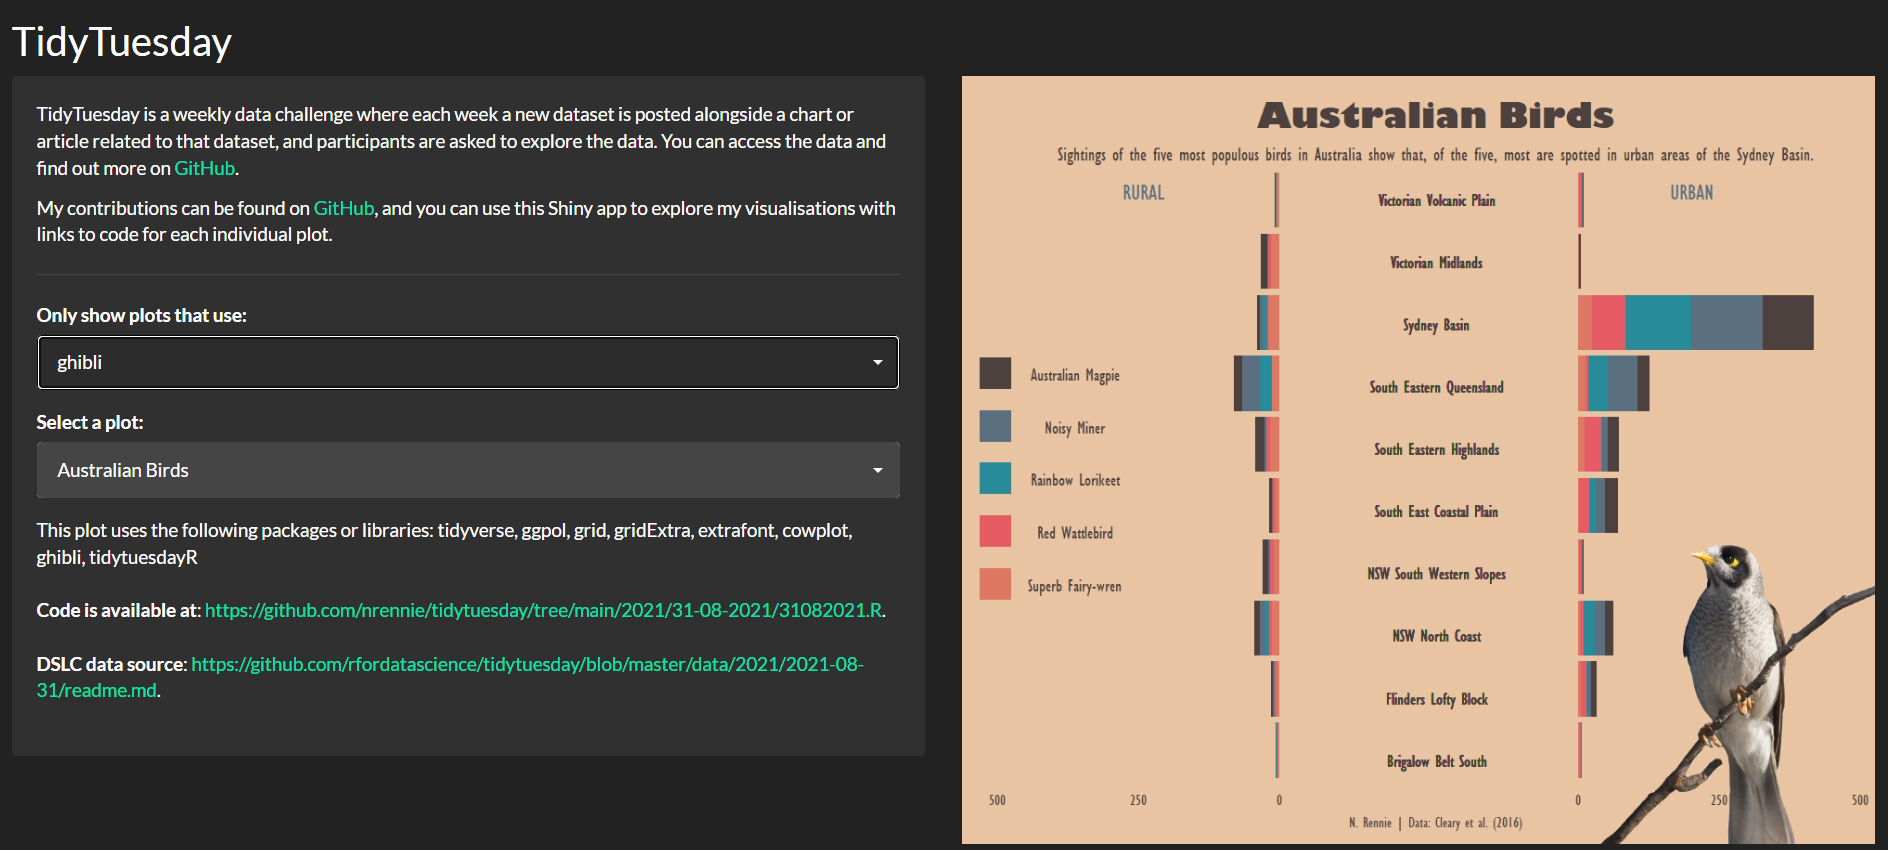
You can also explore my plots using the Shiny app at nrennie.rbind.io/tidytuesday-shiny-app. This app displays every TidyTuesday plot I’ve created, with functionality to search by packages used in creating the plots and links to the original code and data. It automatically updates whenever I create a new plot.