
Network Monitoring with Telegraf / Influxdb / Grafana
- Quick path to demo
- Requiremetns & Installation
- Commands and usage
- Grafana access
- Device List
- Components
- Contributors
Complete stack to monitor Juniper datacenter. it uses following components:
- telegraf : Agent for collecting information from devices. It can be used in 2 different flavor:
snmpand/oropenconfig - influxdb : Time series database (TSN) to store all information sent by telegraf agents.
- grafana : Time series analytics engine to build reports from Influxdb.
All the configuration is managed by templating for following components:
docker-composefiletelegrafconfiguration
Dashboards available:
- Fabric Monitoring: information from generic SNMP based device running in an IP-Fabric environment (Interface counters / BGP status / BGP Update and state messages)
- Fabric Reporting: information from all Junos SNMP based devices running in an IP-Fabric environment (Hw type / Serial number / Junos Version)
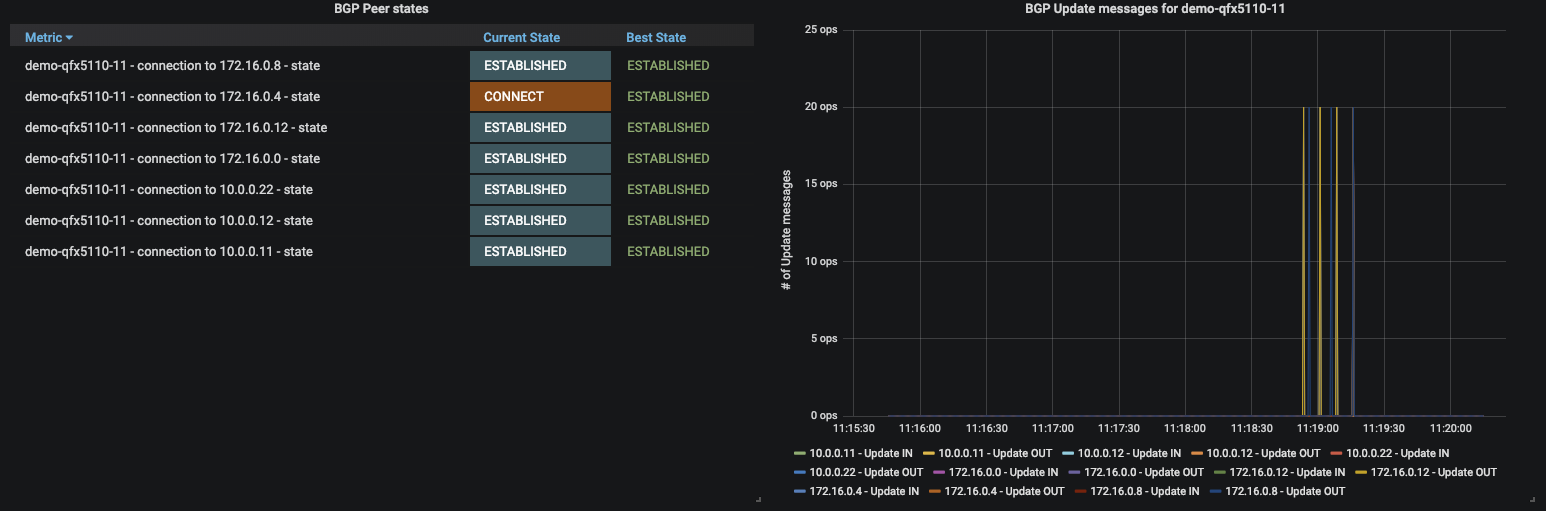
Quick path to demo
# Install python requirements
pip intall -r requirements.txt

# Edit data.yml to add your devices
vim data.yml

# Build and start stack
make build

# Stop and delete stack
make destroy
Open a browser to http://127.0.0.1:9081/ with super/juniper123
Requiremetns & Installation
As it is based on docker, you have to install docker first:
Then,, you have to install python requirements
pip install -r requirements.txt
Commands and usage
Define your targets by editing data.yml file:
Grafana access
Access to grafna can be managed in data.yml file with the following section:
grafana:
  web:
    port: "9081"
    username: "super"
    password: "juniper123"
If not set, access is configured to be like: http://127.0.0.1:9081/ with username/password set to super/juniper123
Device List
SNMP devices
---
telegraf:
  snmp:
    community: "public"
    hosts:
      172.25.90.67: 161
      172.25.90.68: 161
Junos Openconfig devices
---
telegraf:
  openconfig:
    username: 'ansible'
    password: 'juniper123'
    hosts:
      172.25.90.67: 32768
      172.25.90.68: 32768
Both
snmpandopenconfigdefinition can be configure in thisdata.yml
Some commands are available to manage repository
make build-telegraf-conf: Build telegraf configuration with template renderingmake build: Build telegraf config, build docker-compose stack, start stackmake destroy: Stop docker stack and remove containersmake start: start an already configured stack. (Must be done if stack were built previously)make stop: stop running stack. Containers are not deleted and can be restarted withmake startmake restart: stop and start stackmake rebuild: destroy and build stackmake {telegraf-snmp|telegraf-openconfig|influxdb|grafana}-cli: connect to containers
Components
Repository is based on docker containers and they are all managed with docker-compose:
telegraf:1.9.1image for openconfig pollinginetsix/telegraf-snmpimage for SNMP pollinginfluxdb:1.7.2grafana:grafana/grafana:5.4.2