visualization
a collection of visualization operation for easier usage, check usage for a quick start.
New Features
2021/10/4
- Add
draw_line_chartfunction, please check drawer.py
2021/09/29
- Add pip installation
- Build a cleaner repo
Contents
Visualization Function
Learning Notes Sharing
Relative Blogs
Installation
pip install visualize==0.5.1
Usage
Run Example
You can try example.py by cloning this repo for a quick start.
git clone https://github.com/rentainhe/visualization.git
python example.py
results will be saved to ./test_grid_attention and ./test_region_attention
Region Attention Visualization
download the example.jpg to any folder you like

$ wget https://github.com/rentainhe/visualization/blob/master/visualize/test_data/example.jpg
build the following python script for a quick start
import numpy as np
from visualize import visualize_region_attention

img_path="path/to/example.jpg"
save_path="example"
attention_retio=1.0
boxes = np.array([[14, 25, 100, 200], [56, 75, 245, 300]], dtype='int')
boxes_attention = [0.36, 0.64]
visualize_region_attention(img_path,
                           save_path=save_path,
                           boxes=boxes,
                           box_attentions=boxes_attention,
                           attention_ratio=attention_retio,
                           save_image=True,
                           save_origin_image=True,
                           quality=100)
img_path: where to load the original imageboxes: a list of coordinates for the bounding boxesbox_attentions: a list of attention scores for each bounding boxattention_ratio: a special param, if you set the attention_ratio larger, it will make the attention map look more shallow. Just try!save_image=True: save the image with attention map or not, e.g., default: True.save_original_image=True: save the original image at the same time, e.g., default: True
Note that you can check Region Attention Visualization here for more details
Grid Attention Visualization
download the example.jpg to any folder you like
$ wget https://github.com/rentainhe/visualization/blob/master/visualize/test_data/example.jpg
build the following python script for a quick start
from visualize import visualize_grid_attention_v2
import numpy as np

img_path="./example.jpg"
save_path="test"
attention_mask = np.random.randn(14, 14)
visualize_grid_attention_v2(img_path,
                           save_path=save_path,
                           attention_mask=attention_mask,
                           save_image=True,
                           save_original_image=True,
                           quality=100)
img_path: where the image you want to put an attention mask on.save_path: where to save the image.attention_mask: the attention mask with formatnumpy.ndarray, its shape is (H, W)save_image=True: save the image with attention map or not, e.g., default: True.save_original_image=True: save the original image at the same time, e.g., default: True
Note that you can check Grid Attention Visualization here for more details
Draw Line Chart
build the following python script for a quick start
from visualize import draw_line_chart

# test data
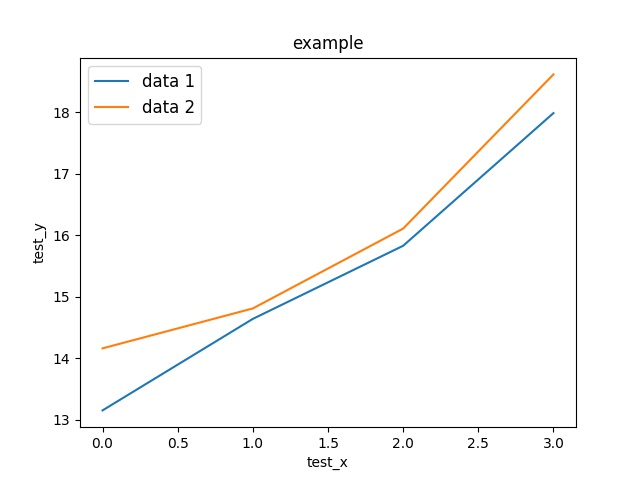
data1 = {"data": [13.15, 14.64, 15.83, 17.99], "name": "data 1"}
data2 = {"data": [14.16, 14.81, 16.11, 18.62], "name": "data 2"}
data_list = []
data_list.append(data1["data"])
data_list.append(data2["data"])
name_list = []
name_list.append(data1["name"])
name_list.append(data2["name"])
draw_line_chart(data_list=data_list,
                labels=name_list,
                xlabel="test_x",
                ylabel="test_y",
                save_path="./test.jpg",
                legend={"loc": "upper left", "frameon": True, "fontsize": 12},
                title="example")
data_list: a list of data to draw.labels: the label corresponds to each data in data_list.xlabel: label of x-axis.ylabel: label of y-axis.save_path: the path to save image.legend: the params of legend.title: the title of the saved image.
You will get the result like this: