

Transportation Network Analysis with Graph Theory 🚚
Use the graph theory to optimise the road transportation network of a retail company

Objective
Build graphical representations of a road transportation network to support network optimisation studies.
Introduction
For a retailer, road transportation between the distribution centre and stores accounts for a significant share of logistics costs. Companies often conduct route-planning optimisation studies to reduce these costs and improve network efficiency.
It requires collaboration between continuous improvement engineers and the transportation teams that manage operations daily.
📘 Your complete guide for Supply Chain Analytics
60+ case studies with source code, dummy data and mathematical concepts here 👉 Analytics Cheat Sheet
Article
In this Article, we will use Graph Theory to design visual representations of a transportation network to support this collaboration and facilitate solution design.
Youtube Video
Click on the image below to access a full tutorial video to understand the concept behind this solution

Scenario
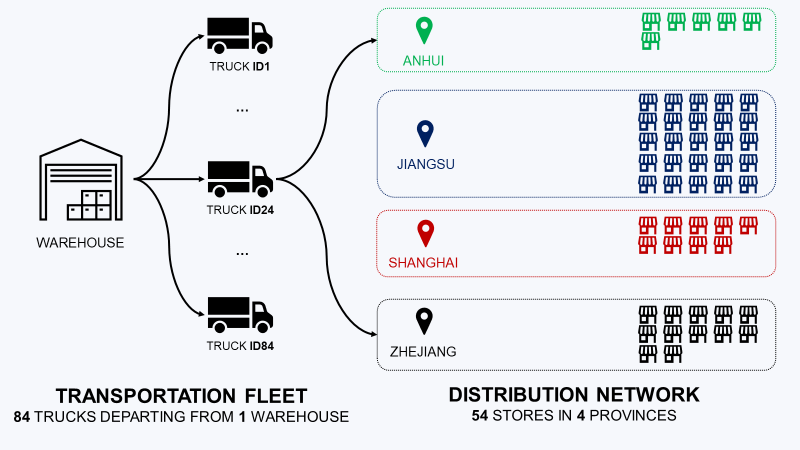
As a continuous improvement engineer of a retail company, you are in charge of reengineering warehousing and transportation operations. In your scope, you have a major distribution centre located in Shanghai (China) that delivers 54 hypermarkets.
Objective
Your objective is to reduce the total cost of transportation.
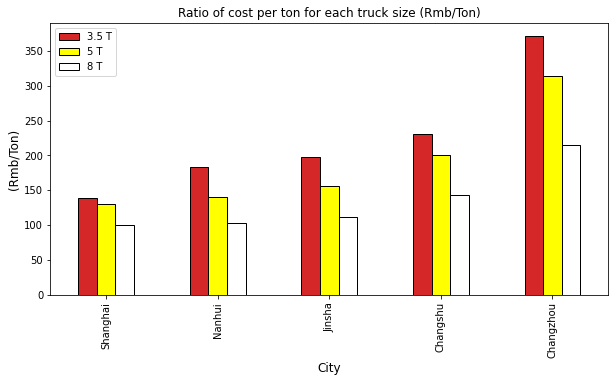
Insights: Cost per Ton
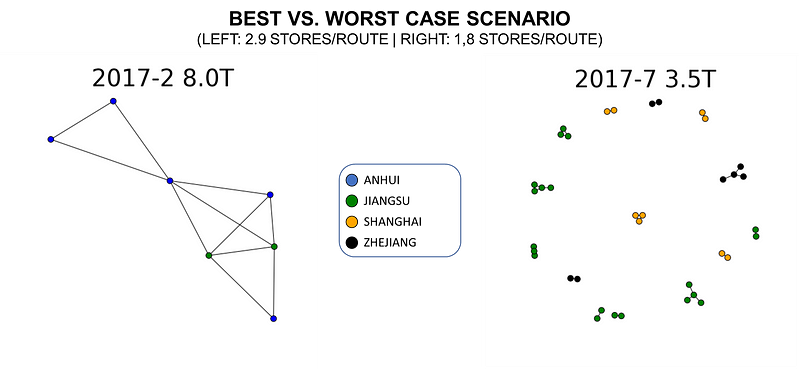
The objective is to design a new transportation plan to increase the average truck size by delivering more stores per route.
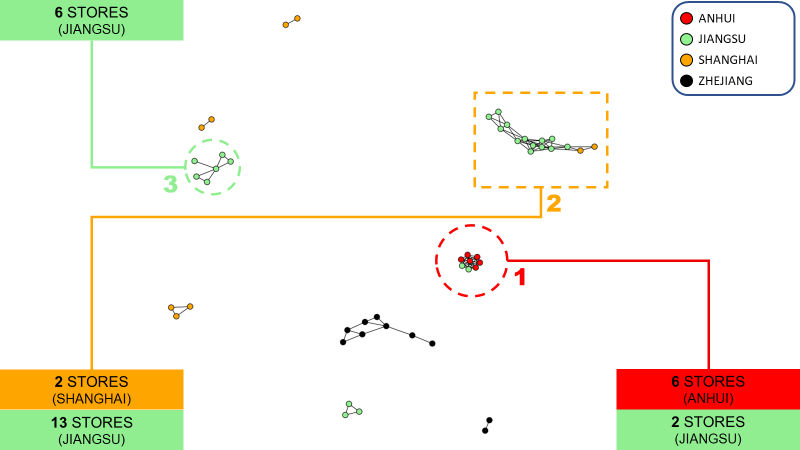
Solution: Graph Theory
A graph is a structure that consists of nodes (vertices) and edges, where each edge connects two nodes.
Further Analysis
With these graphs, you can challenge the current routing and discuss optimisation levers with the transportation teams.
Code
In this repository, you will find all the code used to explain the concepts presented in the article.
Files
Network Graph.ipynb- Jupyter notebook with step-by-step analysisnetwork_graph.py- Standalone Python scriptdata/- Folder containing input data (store province.xlsx, delivery records.xlsx)
Getting Started
pip install -r requirements.txt
python network_graph.py
Dependencies
- numpy
- pandas
- matplotlib
- networkx
- openpyxl
About me 🤓
Senior Supply Chain and Data Science consultant with international experience working on Logistics and Transportation operations. \ For consulting or advising on analytics and sustainable supply chain transformation, feel free to contact me via Logigreen Consulting. \ Please have a look at my personal blog: Personal Website