Home
Softono
s

samirsaci

Professional software vendor delivering innovative solutions on the Softono platform. Specialized in both open-source and proprietary software development.

Total Products
22

Software by samirsaci

n8n_workflow
Open Source

n8n_workflow

# 📦 n8n Workflows Collection [![License: MIT](https://img.shields.io/badge/License-MIT-green.svg)](LICENSE) ![n8n](https://img.shields.io/badge/n8n-Workflows-orange?logo=n8n) ![Automation](https://img.shields.io/badge/AI_Automation-Enabled-blue?logo=OpenAI) ![Status](https://img.shields.io/badge/Status-Active-brightgreen) A curated collection of **production-ready n8n workflows** used across real supply-chain, sustainability, and business automation projects. This repository centralizes all workflows I’ve created for: - ⏰ [**Productivity for Business Professionals and Students**](./Productivity) - ✍️ [**Content Creation, Promotion and Marketing**](./Content_Creation) - 🌳 [**Automation for a More Sustainable World**](./Sustainability) - 🚛 [**Logistics & Supply Chain Automation**](./Supply_Chain) - 🧑‍💻 [**Programming & DevOps**](./DevOps) Each workflow is: - **Ready to deploy** (JSON export included) - **Documented** (clean README inside each folder) - **Modular & reusable** - **Explained in a YouTube tutorial** when available ## 📁 Repository Structure Each workflow has its own folder: ``` /workflow-name/ ├── workflow.json # Import directly into n8n └── README.md # Full presentation + setup instructions ``` ## Folders Below are links to each top-level folder in this repository: I reorganized the workflows into five top-level categories to make navigation easier and grouping more logical. Each category below links to the folder containing related workflows. **⏰ Productivity for Business Professionals and Students** - [🉑 Generate Anki Flash Cards for Language Learning with Google Translate and GPT](./Productivity/Generate_Flash_Cards_for_Language_Learning/) - [🍅 Custom Pomodoro Tracker using Telegram and Google Sheet](./Productivity/Custom_Pomodoro_Tracker_using_Telegram/) - [🏤 Scrapping of European Union Events with Google Sheets](./Productivity/Scrapping_of_European_Union_Events/) - [💰 Automate Currency Rates Update in Invoices with Google Sheet, ExchangeRate API](./Productivity/Automate_Currency_Rates_Update_in_Invoices/) - [📈 Hourly Monitoring of Crypto Rates with Alpha Vantage API and Google Sheets](./Productivity/Hourly_Monitoring_of_Crypto_Rates/) - [🧑‍🎓 AI Powered Language Teacher with Telegram, Google Sheet and GPT-4o](./Productivity/AI_Powered_Language_Teacher_with_Telegram/) - [🏫 English Lesson Generator from Podcasts with RSS, GPT-4, ElevenLabs and Gmail](./Productivity/English_Lesson_Generator_from_Podcasts/) **✍️ Content Creation, Promotion and Marketing** - [✍️ AI Agent to Create Linkedin Posts for Blog Promotion with GPT-4o](./Content_Creation/AI_Agent_to_Create_Linkedin_Posts/) - [✍️ Blog Image SEO & Size Auditor with Ghost and Google Sheets](./Content_Creation/Blog_Image_SEO_Auditor/) - [📰 AI-Powered EU News Digest by Topic with RSS, GPT & Gmail](./Content_Creation/AI-Powered_EU_News_Digest_by_Topic/) - [📸 Automate Photo Background Removal with Photoroom API and Google Drive](./Content_Creation/Automate_Photo_Background_Removal/) - [🧑‍🦯Improve your Website Accessibility with GPT-4o and Google Sheet](./Content_Creation/Improve_your_Website_Accessibility/) - [🖼️ Compress images in a Google Drive folder using Tinify API, Code and Gmail](./Content_Creation/Image_Compression_TinyfyAPI/) **🌳 Automation for a More Sustainable World** - [🌲 AI Agent for Sustainability Report Audit with Gmail and GPT-40](./Sustainability/AI_Agent_for_Sustainability_Report_Audit/) - [🌳 EU Green Legislation Tracker with GPT-4o, Google Sheets and Tasks](./Sustainability/EU_Green_Legislation_Tracker/) - [🗞️ AI-Powered Sustainability Newsletter for Marketing with Gmail, GPT-4o](./Sustainability/AI-Powered_Sustainability_Newsletter/) **🚛 Logistics & Supply Chain Automation** - [🏪 Inventory ABC & Pareto Analysis with Google Sheets for Supply Chain Optimization](./Supply_Chain/Inventory_ABC_And_Pareto_Analysis_Automation/) - [♻️ AI Multi-Stop Planner for Circular Logistics with GPT-4o & Open Route API](./Supply_Chain/AI_Multi-Stop_Planner_for_Circular_Logistics/) - [✈️ CO2 Emissions of Business Travels with Carbon Interface API and GPT-4o](./Supply_Chain/CO2_Emissions_of_Business_Travels/) - [📦 Electronic Data Interchange (EDI) Message Parsing with Gmail and Google Sheet](<./Supply_Chain/Electronic_Data_Interchange_(EDI)_Message_Parsing/>) - [🗼 AI Powered Supply Chain Control Tower with BigQuery and GPT-4o](./Supply_Chain/AI_Powered_Supply_Chain_Control_Tower/) - [🚚 Automate Delivery Confirmation with Telegram Bot, Google Drive and Gmail](./Supply_Chain/Automate_Delivery_Confirmation_with_Telegram_Bot/) - [🚚 CO2 Emissions of Freight Shipments with Carbon Interface API and GPT-4o](./Supply_Chain/CO2_Emissions_of_Freight_Shipments/) - [🚚 Estimate Driving Time and Distance for Logistics with Open Route API](./Supply_Chain/Estimate_Driving_Time_and_Distance_for_Logistics/) - [🚛🗺️ Geocoding for Logistics with Open Route API and Google Sheets](./Supply_Chain/Geocoding_for_Logistics_with_Open_Route_API/) - [🛻 AI Agent for Logistics Order Processing with GPT-4o, Gmail and Google Sheet](./Supply_Chain/AI_Agent_for_Logistics_Order_Processing/) - [🤖🚚 AI agent for Transportation Orders Management with GPT-4o and Open Route API](./Supply_Chain/AI_agent_for_Transportation_Orders_Management/) - [🔄️ AI Powered Inventory Cycle Count Telegram Bot using GPT and Google Sheets](./Supply_Chain/AI_Warehouse_Inventory_Cycle_Count_Bot/) - [📦 AI-Powered Damage Reporting for Logistics Operations (Gmail, Telegram and GPT)](./Supply_Chain/AI_Warehouse_Damage_Report_Bot/) **🧑‍💻 Programming & DevOps** - [🚦 AI Agent for Debugging Workflow Executions with HTTP, Webhook](./DevOps/AI_Agent_for_Debugging_Workflow_Executions/) If you want these as web (GitHub URL) links or added to a separate markdown index file, tell me and I will add it. ## 📺 n8n Tutorials Playlist You can find video walkthroughs for many of these workflows in my dedicated playlist: [![n8n Playlist](https://www.samirsaci.com/content/images/size/w1600/2025/11/image-9.png)
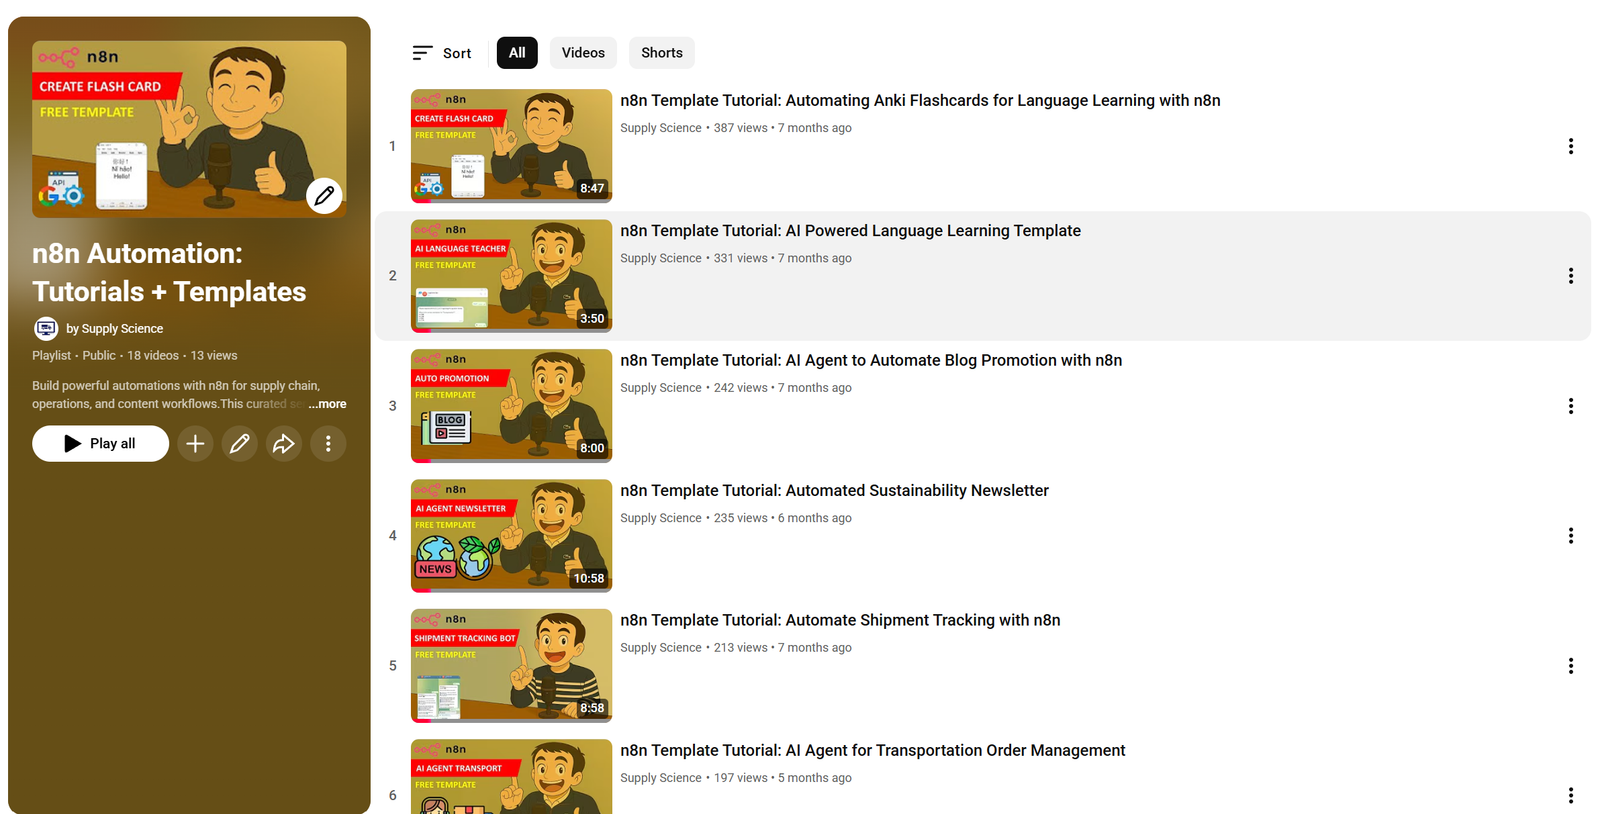
](https://bit.ly/playlist-n8n-supplyscience) ## 👋 About Me Hi! I’m **Samir Saci** — Supply Chain Engineer, Data Scientist, and founder of **LogiGreen Consulting**. I design automation systems using **n8n**, **FastAPI microservices**, and **AI agents** (Claude, OpenAI, MCP). More tutorials & resources on: https://www.samirsaci.com

Workflow Automation Supply Chain
11 Github Stars
budget-planning
Open Source

budget-planning

## Automate Budget Planning using Linear Programming 💰 *Select the projects that maximise the return on investment, follow the management guidelines while respecting budget constraints* <p align="center"> <a href="https://www.samirsaci.com/automate-budget-planning-using-linear-programming/" target="_blank" rel="noopener noreferrer"> <img align="center" src="https://miro.medium.com/max/1280/1*N--GusdlqnmHKdSDkqaEoQ.png" style="max-width: 100%; height: auto;" > </a> </p> ### Objective Automate the decision-making process for the yearly budget allocation of an International Logistics Company. ### Article In this [Article](https://www.samirsaci.com/automate-budget-planning-using-linear-programming/), we will design a simple Linear Programming Model in Python to automate the decision-making process, considering budget constraints, projects, ROI, and management guidelines. ### 📘 Your complete guide for Supply Chain Analytics 60+ case studies with source code, dummy data and mathematical concepts here 👉 [Analytics Cheat Sheet](https://bit.ly/supply-chain-cheat) ### Youtube Video Click on the image below to access a full tutorial video to understand the concept behind this solution <div align="center"> <a href="https://www.youtube.com/watch?v=U_9KGjzGlkA"><img src="https://www.samirsaci.com/content/images/2023/10/image.png" alt="Explainer Video Link"></a> </div> ### Scenario As a **Regional Director** at an international logistics company, you are responsible for logistics operations across four countries. <p align="center"> <a href="https://www.samirsaci.com/automate-budget-planning-using-linear-programming/" target="_blank" rel="noopener noreferrer"> <img align="center" src="https://cdn-images-1.medium.com/max/800/1*dr9aJ5RcxA_cLB16Ko3rIA.png" style="max-width: 100%; height: auto;" > </a> </p>> #### Objective Your role is to find the right budget allocation that maximises your profits (ROI) and respects the guidelines of the top management. <p align="center"> <a href="https://www.samirsaci.com/automate-budget-planning-using-linear-programming/" target="_blank" rel="noopener noreferrer"> <img align="center" src="https://cdn-images-1.medium.com/max/800/1*ry72nFJTW_ncLBifsvUy5Q.png" style="max-width: 100%; height: auto;" > </a> </p> ## Code In this repository, you will find all the code used to explain the concepts presented in the article. ### Files - `Budget Planning Problem.ipynb` - Jupyter notebook with step-by-step analysis - `budget_planning.py` - Standalone Python script ### Getting Started ```bash pip install -r requirements.txt python budget_planning.py ``` ### Dependencies - pandas - pulp - numpy - matplotlib - seaborn - openpyxl ## About me 🤓 Senior Supply Chain and Data Science consultant with international experience working on Logistics and Transportation operations.\ For **consulting or advising** on analytics and sustainable supply chain transformation, feel free to contact me via [Logigreen Consulting](https://www.logi-green.com/).\ For more case studies, check my [Personal Website](https://samirsaci.com).

Budget & Expense Tracking
15 Github Stars
inventory-deterministic
Open Source

inventory-deterministic

## Inventory Management for Retail — Deterministic Demand 📈 *Build a simple model to simulate the impact of several replenishment rules (Basic, EOQ) on the inventory costs and ordering costs* <p align="center"> <a href="https://www.samirsaci.com/inventory-management-for-retail-deterministic-demand/" target="_blank" rel="noopener noreferrer"> <img align="center" src="https://miro.medium.com/max/1280/1*GrAHw2d9Sa5qShf-cKhYYA.png" style="max-width: 100%; height: auto;" > </a> </p> For most retailers, inventory management systems take a fixed, rule-based approach to forecasting and replenishment orders management. Given the demand distribution, the objective is to develop a replenishment policy that minimises your ordering, holding, and shortage costs. -Ordering Costs: fixed cost to place an order due to administrative costs, system maintenance or manufacturing costs in (Euros/Order) - Holding Costs: all the costs required to hold your inventory (storage, insurance, and capital costs) in (Euros/unit x time) - Shortage/Stock-out Costs: the costs of not having enough inventory to meet the customer demand (Lost Sales, Penalty) in (Euros/Unit) ### Article In this [Article](https://www.samirsaci.com/inventory-management-for-retail-deterministic-demand/), we will present a simple methodology using a discrete simulation model built with Python to test several inventory management rules, assuming: - Deterministic Constant Demand: D (Units/Year) - Lead Time between ordering and replenishment (Days) - Cost of shortage and storage (Euros/Unit) ### Problem Statement As an Inventory Manager at a mid-sized retail chain, you are responsible for setting replenishment quantities in the ERP. Based on the store manager's feedback, you begin to doubt that the ERP replenishment rules are optimal, especially for fast-moving items, as your stores are experiencing lost sales due to stockouts. For each SKU, you would like to build a simple simulation model to test several inventory rules and estimate the impact on: - Total Costs: how much does it cost to receive, store and sell this product? - Shortages: what is the % of lost sales due to stock-out? ### Objective 1. Visualise the current rule used by the store's manager 2. Calculate the Economic Order Quantity and simulate the impact 3. Visualise the impact of lead time between ordering and receiving 4. Real-Time Visualisation of COGS for each rule ### Data set This analysis will be based on the M5 Forecasting dataset of Walmart store sales records ([Link](https://www.kaggle.com/c/m5-forecasting-accuracy)). ## Code In this repository, you will find all the code used to explain the concepts presented in the article. ## About me 🤓 Senior Supply Chain and Data Science consultant with international experience working on Logistics and Transportation operations.\ For **consulting or advising** on analytics and sustainable supply chain transformation, feel free to contact me via [Logigreen Consulting](https://www.logi-green.com/)\ Please have a look at my personal blog: [Personal Website](https://samirsaci.com)

Inventory Management Supply Chain
22 Github Stars
segmentation
Open Source

segmentation

# Automate ABC Analysis & Product Segmentation with Streamlit 📈 *A statistical methodology to segment your products based on turnover and demand variability using an automated solution with a web application designed with the framework Streamlit* <p align="center"> <img align="center" src="images/streamlit_capture.PNG" width=75%> </p> <p align="center"><b>streamlit Application UI</b></p> Product segmentation refers to the activity of grouping products that have similar characteristics and serve a similar market. It is usually related to marketing _(Sales Categories)_ or manufacturing _(Production Processes)_. However as a **Supply Chaine Engineer** your focus is not on the product itself but more on the complexity of managing its flow. Your want to understand the sales volumes distribution (fast/slow movers) and demand variability to optimize your production, storage and delivery operations to ensure the best service level by considering: - The highest contribution to your total volume: ABC Analysis - The most unstable demand: Demand Variability I have designed this **Streamlit App** to provide a tool to **Supply Chain Engineers** for Product Segmentation, with a focus on retail products, of their portofolio considering the complexity of the demand and the volumes contribution of each item. ### Understand the theory behind 📜 In this [Article](https://medium.com/towards-data-science/product-segmentation-for-retail-with-python-c85cc0930f9a), you can find details about the theory used to build this tool. # Access the application 🖥️ > Access it here: [Product Segmentation for Retail](https://share.streamlit.io/samirsaci/segmentation/main/segmentation.py) ## **Step 0: Why should you use it?** This Streamlit Web Application has been designed for Supply Chain Engineers to support them in their Inventory Management. It will help you to automate product segmentation using statistics. ## **Step 1: What do you want to do?** You have two ways to use this application: - 🖥️ Look at the results computed by the model using the pre-loaded dataset: in that case you just need to scroll to see the visuals and the analyses OR - 💾 Upload your dataset of sales records that includes columns related to: - **Item master data** _For example: SKU ID, Category, Sub-Category, Store ID_ - **Date of the sales**: _For example: Day, Week, Month, Year_ - **Quantity or value**: this measure will be used for the ABC analysis _For example: units, cartons, pallets or euros/dollars/your local currency_ ## **Step 2: Prepare the analysis** ### **1. 💾 Upload your dataset of sales records** <p align="center"> <img align="center" src="images/step_1.PNG" width=40%> </p> <p align="center"><b>Step 1:</b> upload your dataset of sales records</p> 💡 _Please make sure that you dataset format is csv with a file size lower than 200MB. If you want to increase the size, you'd better copy this repository and deploy the app locally following the instructions below._ ### **2. 📅 [Parameters] select the columns for the date (day, week, year) and the values (quantity, $)** <p align="center"> <img align="center" src="images/step_2.PNG" width=75%> </p> <p align="center"><b>Step 2:</b> select the columns for the date (day, week, year) and the values (quantity, $)</p> 💡 _If you have several columns for the date (day, week, month) and for the values (quantity, amount) you can use only one column per category for each run of calculation._ ### **3. 📉 [Parameters] select all the columns you want to keep in the analysis** <p align="center"> <img align="center" src="images/step_3.PNG" width=75%> </p> <p align="center"><b>Step 3:</b> select the columns for the date (day, week, year)</p> 💡 _This step will basically help you to remove the columns that you do not need for your analysis to increase the speed of computation and reduce the usage of ressources._ ### **4. 🏬 [Parameters] select all the related to product master data (SKU ID, FAMILIY, CATEGORY, STORE LOCATION)** <p align="center"> <img align="center" src="images/step_4.PNG" width=75%> </p> <p align="center"><b>Step 4:</b> select all the related to product master data (SKU ID, FAMILIY, CATEGORY, STORE LOCATION)</p> 💡 _In this step you will show at what granularity you want to do your analysis. For example it can be at:_ - _Item, Store level: that means the same item in two stores will represent two SKU_ - _Item ID level: that means you group the sales of your item in all stores_ ### **5. 🛍️ [Parameters] select one feature you want to use for analysis by family** <p align="center"> <img align="center" src="images/step_5.PNG" width=75%> </p> <p align="center"><b>Step 5:</b> select one feature you want to use for analysis by family</p> 💡 _This feature will be used to plot the repartition of (A, B, C) product by family_ ### **6. 🖱️ Click on Start Calculation? to launch the analysis** <p align="center"> <img align="center" src="images/step_6.PNG" width=75%> </p> <p align="center"><b>Step 6:</b> Start Calculation</p> 💡 _This feature will be used to plot the repartition of (A, B, C) product by family_ # Get insights about your sales records 💡 ### **Pareto Analysis** <p align="center"> <img align="center" src="images/pareto.PNG" width=75%> </p> <p align="center"><b>Concept</b> Pareto Analysis</p> **INSIGHTS:** 1. How many SKU represent 80% of your total sales? 2. How much sales represent 20% of your SKUs? _For more information about the theory behind the pareto law and its application in Supply Chain Management: [Pareto Principle for Warehouse Layout Optimization](https://www.samirsaci.com/reduce-warehouse-space-with-the-pareto-principle-using-python/)_ ### **ABC Analysis with Demand Variability** <p align="center"> <img align="center" src="images/abc_analysis.PNG" width=75%> </p> <p align="center"><b>Streamlit App Screenshot:</b> ABC Analysis plot</p> **QUESTIONS: WHAT IS THE PROPORTION OF?** 1. **LOW IMPORTANCE SKUS**: C references 2. **STABLE DEMAND SKUS**: A and B SKUs with a coefficient of variation below 1 3. **HIGH IMPORTANCE SKUS**: A and B SKUS with a high coefficient of variation Your inventory management strategies will be impacted by this split: - A minimum effort should be put in **LOW IMPORTANCE SKUS** - Automated rules with a moderate attention for **STABLE SKUS** - Complex replenishment rules and careful attention for **HIGH IMPORTANCE SKUS** _For more information: [Article](https://www.samirsaci.com/product-segmentation-for-retail-with-python/)_ <p align="center"> <img align="center" src="images/split_category.PNG" width=75%> </p> <p align="center"><b>Streamlit App Screenshot:</b> ABC SKU split for each family/category</p> **QUESTIONS:** 1. What is the split of SKUS by FAMILY? 2. What is the split of SKUS by ABC class in each FAMILY? ### **Normality Test** <p align="center"> <img align="center" src="images/normality.PNG" width=75%> </p> <p align="center"><b>Streamlit App Screenshot:</b> Normality test</p> **QUESTION:** - Which SKUs have a sales distribution that follows a normal distribution? Many inventory rules and safety stock formula can be used only if the sales distribution of your item is following a normal distribution. Thefore, it's better to know the % of your portofolio that can be managed easily. _For more information: [Inventory Management for Retail — Stochastic Demand](https://www.samirsaci.com/inventory-management-for-retail-stochastic-demand-2/)_ # Build the application locally 🏗️ ## **Build a python local environment (recommanded)** ### Then install **virtualenv** using pip3 sudo pip3 install virtualenv ### Now create a virtual environment virtualenv venv ### Active your virtual environment source venv/bin/activate ## Launch Streamlit 🚀 ### Install all dependencies needed using requirements.txt pip install -r requirements.txt ### Run the application streamlit run segmentation.py ### Click on the Network URL in the shell <p align="center"> <img align="center" src="images/network.PNG" width=50%> </p> > -> Enjoy! # About me 🤓 Senior Supply Chain Engineer with an international experience working on Logistics and Transportation operations. \ Have a look at my portfolio: [Data Science for Supply Chain Portfolio](https://samirsaci.com) \ For **consulting or advising** on analytics and sustainable supply chain transformation, feel free to contact me via [Logigreen Consulting](https://www.logi-green.com/) \ Data Science for Warehousing📦, Transportation 🚚 and Demand Forecasting 📈

Inventory Management BI Dashboards
22 Github Stars
inventory-stochastic
Open Source

inventory-stochastic

## Inventory Management for Retail — Stochastic Demand 📈 *Simulate the impact of safety stock level on inventory management performance metrics, assuming a normal distribution of your demand* <p align="center"> <a href="https://www.samirsaci.com/inventory-management-for-retail-stochastic-demand-2/" target="_blank" rel="noopener noreferrer"> <img align="center" src="https://miro.medium.com/max/1280/1*qd_L-_YIZwrgwvt9WHkk-w.png" style="max-width: 100%; height: auto;" > </a> </p> For most retailers, inventory management systems adopt a fixed, rule-based approach to forecasting and order replenishment. Given the demand distribution, the objective is to develop a replenishment policy that minimises ordering, holding, and shortage costs. ### Article In this [Article](https://www.samirsaci.com/inventory-management-for-retail-stochastic-demand-2/), we will improve this model and introduce a simple methodology using a discrete simulation model built with Python to test several inventory management rules, assuming a normal distribution of the customer demand. ### Problem Statement As an Inventory Manager at a mid-sized retail chain, you are responsible for setting replenishment quantities in the ERP. Based on the store manager's feedback, you begin to doubt that the ERP replenishment rules are optimal, particularly for fast-moving items, as your stores are experiencing lost sales due to stockouts. For each SKU, you would like to build a simple simulation model to test several inventory rules and estimate the impact on: - Performance Metrics - Cycle Service Level (CSL): probability to have a stock-out for each cycle (%) - Item Fill Rate (IFR): percentage of customer demand met without stock-out (%) ### Question What impacts your logistic performance? ### Data set This analysis will be based on the M5 Forecasting dataset of Walmart stores' sales records ([Link](https://www.kaggle.com/c/m5-forecasting-accuracy)). ## Code In this repository, you will find all the code used to explain the concepts presented in the article. ### Files - `Inventory Management - Stochastic.ipynb` - Jupyter notebook with step-by-step analysis - `inventory_stochastic.py` - Standalone Python script ### Getting Started ```bash pip install -r requirements.txt python inventory_stochastic.py ``` ### Dependencies - pandas - matplotlib - numpy - scipy - seaborn - statsmodels ## About me 🤓 Senior Supply Chain and Data Science consultant with international experience working on Logistics and Transportation operations.\ For **consulting or advising** on analytics and sustainable supply chain transformation, feel free to contact me via [Logigreen Consulting](https://www.logi-green.com/).\ For more case studies, check my [Personal Website](https://samirsaci.com).

Inventory Management Supply Chain
21 Github Stars
inventory-periodic
Open Source

inventory-periodic

## Inventory Management for Retail — Stochastic Demand 📈 *Implement inventory management rules based on a periodic review policy to reduce the number of store replenishments* <p align="center"> <a href="https://www.samirsaci.com/inventory-management-for-retail-stochastic-demand-2/" target="_blank" rel="noopener noreferrer"> <img align="center" src="https://miro.medium.com/max/1280/1*IKoODTaPlZ1I6GdZ4vGwow.png" style="max-width: 100%; height: auto;" > </a> </p> For most retailers, inventory management systems take a fixed, rule-based approach to forecasting and managing replenishment orders. The objective is to develop a replenishment policy that minimises ordering, holding, and shortage costs. In a previous article, we built a simulation model based on a continuous-review inventory policy, assuming a normal demand distribution. However, this policy can be inefficient when managing a portfolio of items with varying replenishment cycles. ### Article In this [Article](https://www.samirsaci.com/inventory-management-for-retail-stochastic-demand-2/), we will improve this model and implement a periodic review policy with Python to limit the number of replenishments. ### Problem Statement As an Inventory Manager at a mid-sized retail chain, you are responsible for setting replenishment quantities in the ERP. Because your warehouse operations manager is complaining about order frequency, you begin to challenge the replenishment rules implemented in the ERP, especially for the fast-runners. Previously, we have implemented several inventory rules based on continuous review policies. ### Question What would be the number of replenishments if you have 2,500 SKUs? ### Data set This analysis will be based on Dummy Data shared in this folder. **Note:** Please unpack the `.rar` file in the `data` folder to extract the CSV file before running the script. ## Code In this repository, you will find all the code used to explain the concepts presented in the article. ### Files - `Inventory Management - Stochastic Periodic.ipynb` - Jupyter notebook with step-by-step analysis - `inventory_periodic.py` - Standalone Python script ### Getting Started ```bash pip install -r requirements.txt python inventory_periodic.py ``` ### Dependencies - pandas - matplotlib - numpy - scipy ## About me 🤓 Senior Supply Chain and Data Science consultant with international experience working on Logistics and Transportation operations.\ For **consulting or advising** on analytics and sustainable supply chain transformation, feel free to contact me via [Logigreen Consulting](https://www.logi-green.com/).\ For more case studies, check my [Personal Website](https://samirsaci.com).

ML Frameworks Supply Chain
15 Github Stars
product-segmentation
Open Source

product-segmentation

## Product Segmentation for Retail with Python 📈 *A statistical methodology to segment your products based on turnover and demand variability* <p align="center"> <a href="https://www.samirsaci.com/product-segmentation-for-retail-with-python/" target="_blank" rel="noopener noreferrer"> <img align="center" src="https://miro.medium.com/max/1280/1*JhUhKtJdNQR2QA4IkRTtEw.png" style="max-width: 100%; height: auto;" > </a> </p> Product segmentation is the process of grouping products with similar characteristics and serving the same market. It is usually related to marketing (Sales Categories) or manufacturing (Production Processes). However, as a Logistics Manager, you rarely care about the product itself when managing goods flows, except for the dangerous and oversized products. Your attention is primarily focused on the distribution of sales volumes (fast/slow movers), demand variability, and delivery lead time. You want to put effort into managing products that have: - The highest contribution to your total turnover: ABC Analysis - The most unstable demand: Demand Variability ### Article In this [Article](https://www.samirsaci.com/product-segmentation-for-retail-with-python/), we will introduce simple statistical tools to combine ABC Analysis and Demand Variability to perform product segmentation. ### Problem Statement You are the Operational Director of a local Distribution Center (DC) that delivers 10 Hypermarkets. In your scope, you have the responsibility of - Preparation and delivery of replenishment orders from stores * Demand Planning and Inventory Management ### Question What impacts your logistic performance? ### Data set This analysis will be based on the M5 Forecasting dataset of Walmart stores' sales records ([Link](https://www.kaggle.com/c/m5-forecasting-accuracy). ## Code In this repository, you will find all the code used to explain the concepts presented in the article. ## About me 🤓 Senior Supply Chain Engineer with international experience working on Logistics and Transportation operations. \ Please have a look at my portfolio: [Data Science for Supply Chain Portfolio](https://samirsaci.com) \ For **consulting or advising** on analytics and sustainable supply chain transformation, feel free to contact me via [Logigreen Consulting](https://www.logi-green.com/) \ Data Science for Warehousing📦, Transportation 🚚 and Demand Forecasting 📈

Analytics & BI Supply Chain
13 Github Stars
picking-route
Open Source

picking-route

# Improve Warehouse Productivity using Order Batching with Python 📦 In a **Distribution Centre (DC)**, walking time between locations during the picking route can account for 60%-70% of an operator’s working time. Reducing this walking time is the most effective way to increase your DC overall productivity. <p align="center"> <a href="https://www.samirsaci.com/improve-warehouse-productivity-using-order-batching-with-python/" target="_blank" rel="noopener noreferrer"> <img align="center" src="static/img/intro_1.gif" style="max-width: 75%; height: auto;"> </a> </p> <p align="center"><b>Scenario 1:</b> Picking routes with 1 order picked per wave</p>> I have published a series of articles proposing an approach to design a model that simulates the impact of multiple picking processes and routing methods to identify optimal order picking using the Single Picker Routing Problem (SPRP) for a two-dimensional warehouse model (axis-x, axis-y). SPRP is a specific application of the general **Travelling Salesman Problem (TSP)** answering the question: > “Given a list of storage locations and the distances between each pair of locations, what is the shortest possible route that visits each storage location and returns to the depot ?” This repo contains a ready-to-use **Streamlit App** designed for **Logistics Engineers** to test these different strategies by only uploading their own dataset of order line records. ### Understand the theory behind 📜 - Improve Warehouse Productivity using Order Batching with Python - [Article](https://www.samirsaci.com/improve-warehouse-productivity-using-order-batching-with-python/) - Improve Warehouse Productivity using Spatial Clustering with Python Scipy - [Article](https://www.samirsaci.com/improve-warehouse-productivity-using-spatial-clustering-with-python/) - Design Pathfinding Algorithm using Google AI to Improve Warehouse Productivity - [Article](https://www.samirsaci.com/improve-warehouse-productivity-using-pathfinding-algorithm-with-python/) # Picking Route Optimisation 🚶‍♂️ ## 💾 **Initial: prepare order lines datasets with picking locations** Based on your **actual warehouse layout**, storage locations are mapped with **2-D (x, y) coordinates** that will be used to measure walking distance. <p align="center"> <a href="https://www.samirsaci.com/improve-warehouse-productivity-using-order-batching-with-python/" target="_blank" rel="noopener noreferrer"> <img align="center" src="static/img/warehouse_layout.png" style="max-width: 75%; height: auto;"> </a> </p> <p align="center">Warehouse Layout with 2D Coordinates</p> Every storage location must be linked to a Reference using Master Data. (For instance, reference #123129 is located in coordinate (xi, yi)). You can then associate every order line to a geographical location for picking. <p align="center"> <a href="https://www.samirsaci.com/improve-warehouse-productivity-using-order-batching-with-python/" target="_blank" rel="noopener noreferrer"> <img align="center" src="static/img/processing_layout.png" style="max-width: 75%; height: auto;"> </a> </p> <p align="center">Database Schema</p> Order lines can be extracted from your WMS Database. This table should be joined with the Master Data table to link each order line to a storage location and specify its (x, y) coordinates in your warehouse. Extra tables can be added to include more parameters in your model, like (Destination, Delivery lead time, Special Packing, ..). ## 🧪 **Experiment 1: Impacts of wave picking on the pickers' walking distance?** _For more information and details about calculation: [Medium Article](https://medium.com/towards-data-science/optimizing-warehouse-operations-with-python-part-1-83d02d001845)_ ### ✔️ Problem Statement For this study, we will use an E-Commerce-type DC where items are stored on 4-level shelves. These shelves are organized in multiple rows (Row#: 1 … n) and aisles (Aisle#: A1 … A_n). <p align="center"> <a href="https://www.samirsaci.com/improve-warehouse-productivity-using-order-batching-with-python/" target="_blank" rel="noopener noreferrer"> <img align="center" src="static/img/trolley.jpeg" style="max-width: 35%; height: auto;"> </a> </p> <p align="center">Different routes between two storage locations in the warehouse</p> 1. Item Dimensions: Small and light dimensions of items 2. Picking Cart: lightweight picking cart with a capacity of 10 orders 3. Picking Route: Picking Route starts and ends at the exact location Scenario 1, the worst in terms of productivity, can be easily optimised because of - Locations: Orders #1 and #2 have common picking locations - Zones: orders have picking locations in a common zone - Single-line Orders: items_picked/walking_distance efficiency is very low <p align="center"> <a href="https://www.samirsaci.com/improve-warehouse-productivity-using-order-batching-with-python/" target="_blank" rel="noopener noreferrer"> <img align="center" src="static/img/wave_picking.gif" style="max-width: 75%; height: auto;"> </a> </p> <p align="center"><b>Scenario 2:</b> Wave Picking applied to Scenario 1</p> The first intuitive way to optimise this process is to combine these three orders into a single picking route — a strategy commonly called Wave Picking. We will build a model to simulate the impact of several wave-picking strategies on the total walking distance for a specific set of orders. ### 📊 Simulation In the article, I have built a set of functions needed to run different scenarios and simulate the picker's walking distance. **Function:** Calculate the distance between two picking locations <p align="center"> <a href="https://www.samirsaci.com/improve-warehouse-productivity-using-order-batching-with-python/" target="_blank" rel="noopener noreferrer"> <img align="center" src="static/img/batch_function_1.png" style="max-width: 75%; height: auto;"> </a> </p> <p align="center"><b>Function:</b> Different routes between two storage locations in the warehouse</p> This function calculates the walking distance between points i (xi, yi) and j (xj, yj). Objective: return the shortest walking distance between the two potential routes from point i to point j. > Parameters - y_low: lowest point of your alley (y-axis) - y_high: highest point of your alley (y-axis) **Function:** The Next Closest Location <p align="center"> <a href="https://www.samirsaci.com/improve-warehouse-productivity-using-order-batching-with-python/" target="_blank" rel="noopener noreferrer"> <img align="center" src="static/img/batch_function_2.png" style="max-width: 75%; height: auto;"> </a> </p> <p align="center"><b>Function:</b> Next Storage Location Scenario</p> This function will choose the next location among several candidates to continue your picking route. Objective: return the closest location as the best candidate This function will create your picking route from a set of orders to prepare. - Input: a list of (x, y) locations based on items to be picked for this route - Output: an ordered sequence of locations covered and total walking distance **Function:** Create batches of n orders to be picked at the same time - Input: order lines data frame (df_orderlines), number of orders per wave (orders_number) - Output: data frame mapped with wave number (Column: WaveID), the total number of waves (waves_number) **Function:** listing picking locations of wave_ID picking route - Input: order lines data frame (df_orderlines) and wave number (waveID) - Output: list of locations i(xi, yi) included in your picking route ### ☑️ **Results and Next Steps** After setting up all necessary functions to measure picking distance, we can now test our picking route strategy with picking order lines. Here, we first decided to start with a very simple approach - Orders Waves: orders are grouped by chronological order of receiving time from OMS ( TimeStamp) - Picking Route: The picking route strategy follows the Next Closest Location logic To estimate the impact of wave picking strategy on your productivity, we will run several simulations with a gradual number of orders per wave: 1. Measure Total Walking Distance: how much walking distance is reduced when the number of orders per route is increased? 2. Record Picking Route per Wave: recording the sequence of locations per route for further analysis <p align="center"> <a href="https://www.samirsaci.com/improve-warehouse-productivity-using-order-batching-with-python/" target="_blank" rel="noopener noreferrer"> <img align="center" src="static/img/batch_final.png" style="max-width: 100%; height: auto;"> </a> </p> <p align="center"><b>Experiment 1:</b> Results for 5,000 order lines with a ratio from 1 to 9 orders per route</p> ## 🧮**Experiment 2: Impacts of orders batching using spatial clusters of picking locations?** _For more information and details about calculation: [Article](https://medium.com/towards-data-science/optimizing-warehouse-operations-with-python-part-2-clustering-with-scipy-for-waves-creation-9b7c7dd49a84) <p align="center"> <a href="https://www.samirsaci.com/improve-warehouse-productivity-using-order-batching-with-python/" target="_blank" rel="noopener noreferrer"> <img align="center" src="static/img/cluster_process.png" style="max-width: 100%; height: auto;"> </a> </p> <p align="center"><b>Order Lines Processing</b> for Order Wave Picking using Clustering by Picking Location</p> ### 💡**Idea: Picking Locations Clusters** ### Group picking locations by clusters to reduce the walking distance for each picking route. _(Example: the maximum walking distance between two locations is <15 m)_ Spatial clustering is the task of grouping together a set of points in a way that objects in the same cluster are more similar to each other than to objects in other clusters. For this part we will split the orders in two categories: - Mono-line orders: they can be associated to a unique picking locations - Multi-line orders: that are associated with several picking locations #### **Mono-line orders** <p align="center"> <a href="https://www.samirsaci.com/improve-warehouse-productivity-using-order-batching-with-python/" target="_blank" rel="noopener noreferrer"> <img align="center" src="static/img/cluster_walking_distance.png" style="max-width: 100%; height: auto;"> </a> </p> <p align="center">Left [Clustering using Walking Distance] / Right [Clustering using Euclidian Distance]</p> _Grouping orders in cluster within n meters of walking distance_ #### **Multi-line orders** <p align="center"> <a href="https://www.samirsaci.com/improve-warehouse-productivity-using-order-batching-with-python/" target="_blank" rel="noopener noreferrer"> <img align="center" src="static/img/cluster_centroids.png" style="max-width: 75%; height: auto;"> </a> </p> <p align="center"><b>Example: </b>Centroid of three Picking Locations</p> _Grouping multi-line orders in cluster (using centroids of picking locations) within n meters of walking distance_ ### 🐁 **Model Simulation** ### #### **Methodology** To sum up, our model construction, see the chart below, we have several steps before Picking Routes Creation using Wave Processing. At each step, we have a collection of parameters that can be tuned to improve performance: <p align="center"> <a href="https://www.samirsaci.com/improve-warehouse-productivity-using-order-batching-with-python/" target="_blank" rel="noopener noreferrer"> <img align="center" src="static/img/cluster_analysis.png" style="max-width: 100%; height: auto;"> </a> </p> <p align="center"><b>Methodology: </b>Model Construction with Parameters</p> #### **Comparing three methods of wave creation** <p align="center"> <a href="https://www.samirsaci.com/improve-warehouse-productivity-using-order-batching-with-python/" target="_blank" rel="noopener noreferrer"> <img align="center" src="static/img/wave_creation.png" style="max-width: 75%; height: auto;"> </a> </p> <p align="center"><b>Methodology: </b>Three Methods for Wave Processing</p> We’ll start first by assessing the impact of Order Wave processing by clusters of picking locations on total walking distance. We’ll be testing three different methods: - Method 1: we do not apply clustering (i.e Initial Scenario) - Method 2: we apply clustering on single-line orders only - Method 3: we apply clustering to single-line orders and centroids of multiline orders #### **Parameters of Simulation** - Order lines: 20,000 Lines - Distance Threshold: Maximum distance between two picking locations _(distance_threshold = 35 m)_ - Orders per Wave: orders_number in [1, 9] #### **Final Results** <p align="center"> <a href="https://www.samirsaci.com/improve-warehouse-productivity-using-order-batching-with-python/" target="_blank" rel="noopener noreferrer"> <img align="center" src="static/img/cluster_final_results.png" style="max-width: 100%; height: auto;"> </a> </p> <p align="center"><b>Test 1:</b> 20,000 Order Lines / 35 m distance Threshold</p> - Best Performance: Method 3 for 9 orders/Wave with 83% reduction of walking distance - Method 2 vs. Method 1: Clustering for mono-line orders reduce the walking distance by 34% - Method 3 vs. Method 2: Clustering for mono-line orders reduce the walking distance by 10% # Build the application locally 🏗️ Because the resources provided by Streamlit Cloud or Heroku are limited, I suggest running this application locally. ## **Build a Python local environment (recommended)** ### Then install **virtualenv** using pip3 ``` sudo pip3 install virtualenv ``` ### Now, create a virtual environment ``` virtualenv venv ``` ### Active your virtual environment ``` source venv/bin/activate ``` ## Launch Streamlit 🚀 ### Install all dependencies needed using requirements.txt ``` pip install -r requirements.txt ``` ### Run the application ``` streamlit run app.py --server.address 0.0.0.0 ``` ### Click on the URL <p align="center"> <a href="https://www.samirsaci.com/improve-warehouse-productivity-using-order-batching-with-python/" target="_blank" rel="noopener noreferrer"> <img align="center" src="static/img/launch_streamlit.png" style="max-width: 50%; height: auto;"> </a> </p> <p align="center"><b>Instructions:</b> Click on the URL</p> > -> Enjoy! # Use the application 🖥️ > This app has not been deployed; you need to use it locally/. ## **Why should you use it?** This Streamlit Web Application has been designed for Supply Chain Engineers to help them simulate the impact on picking route optimization on the total distance of their picking operators. ## **Load the data** - You can use the dataset located in the folder In/df_lines.csv - You can build your own dataset following the steps of ('Initial Step') above ## 🔬 Experiment 1 <p align="center"> <a href="https://www.samirsaci.com/improve-warehouse-productivity-using-order-batching-with-python/" target="_blank" rel="noopener noreferrer"> <img align="center" src="static/img/params_1.PNG" style="max-width: 75%; height: auto;"> </a> </p> <p align="center"><b>Experiment 1:</b> Parameters</p> ### **Step 1:** Scope As the computation time can increase exponentially with the size of the dataset _(optimisation can be done)_ you can ask the model to take only the first n thousand lines for analysis. ### **Step 2:** Fix the range of orders/wave to simulate In the picture below, we ask the model to run a loop testing scenarios with the number of orders per wave varying between 1 and 10. ### **Step 3:** START CALCULATION Click the button to start the calculations. ### **Final Results** <p align="center"> <a href="https://www.samirsaci.com/improve-warehouse-productivity-using-order-batching-with-python/" target="_blank" rel="noopener noreferrer"> <img align="center" src="static/img/batch_results.png" style="max-width: 75%; height: auto;"> </a> </p> <p align="center"><b>Experiment 1:</b> Final Results</p> 💡 This is the same graph as the one presented in the article ## 🧪 Experiment 2 <p align="center"> <a href="https://www.samirsaci.com/improve-warehouse-productivity-using-order-batching-with-python/" target="_blank" rel="noopener noreferrer"> <img align="center" src="static/img/params_2.PNG" style="max-width: 75%; height: auto;"> </a> </p> <p align="center"><b>Experiment 2:</b> Parameters</p>> ### **Step 1:** Scope As the computation time can increase exponentially with the size of the dataset _(optimisation can be done)_ you can ask the model to take only the first n thousand lines for analysis. ### **Step 2:** START CALCULATION Click the button to start the calculations. ### **Final Results** <p align="center"> <a href="https://www.samirsaci.com/improve-warehouse-productivity-using-order-batching-with-python/" target="_blank" rel="noopener noreferrer"> <img align="center" src="static/img/streamlit_picking_route.png" style="max-width: 75%; height: auto;"> </a> </p> <p align="center"><b>Experiment 2:</b> Final Results</p>> 💡 This is the same graph with the one presented in the article ## About me 🤓 Senior Supply Chain and Data Science consultant with international experience working on Logistics and Transportation operations.\ For **consulting or advising** on analytics and sustainable supply chain transformation, feel free to contact me via [Logigreen Consulting](https://www.logi-green.com/)\ Please have a look at my personal blog: [Personal Website](https://samirsaci.com)

ML Frameworks Supply Chain
136 Github Stars
supply-chain-optimization
Open Source

supply-chain-optimization

## Supply Chain Optimisation with Python 👷 *Find the optimal locations of your manufacturing facilities to meet your customers’ demand and reduce production costs* <p align="center"> <a href="https://www.samirsaci.com/supply-chain-optimization-with-python/"><img align="center" src="https://www.samirsaci.com/content/images/size/w1200/2025/12/temp-49.png"></a> </p> ### Article In this [Article](https://www.samirsaci.com/supply-chain-optimization-with-python/), we will present a simple methodology using Linear Programming for Supply Chain Optimisation, considering - Fixed production costs of your facilities ($/Month) - Variable production costs per unit produced ($/Unit) - Shipping costs ($) - Customer’s demand (Units) ### Youtube Video Click on the image below to access a full tutorial to understand the concept behind this solution <div align="center"> <a href="https://www.youtube.com/watch?v=gF9ds3CH3N4"><img src="https://www.samirsaci.com/content/images/2026/01/image-146.png" alt="Video Link"></a> </div> #### Problem Statement As the Head of Supply Chain Management of an international manufacturing company, you want to redefine the Supply Chain Network for the next 5 years, taking into account the recent increase in shipping costs and demand forecasts. <p align="center"> <a href="https://www.samirsaci.com/supply-chain-optimization-with-python/"><img align="center" src="https://www.samirsaci.com/content/images/2025/12/image-767.png"></a> </p> ## Code In this repository, you will find all the code used to explain the concepts presented in the article. ### Files - `Supply Chain Optimization.ipynb` - Jupyter notebook with step-by-step analysis - `supply_chain_optimization.py` - Standalone Python script ### Getting Started This project uses [uv](https://docs.astral.sh/uv/) for dependency management. ```bash # Install dependencies uv sync # Run the Python script uv run python supply_chain_optimization.py # Or launch Jupyter notebook uv run jupyter notebook ``` ### Dependencies - pandas - pulp - openpyxl - jupyter ## About me 🤓 Senior Supply Chain and Data Science consultant with international experience working on Logistics and Transportation operations. \ For **consulting or advising** on analytics and sustainable supply chain transformation, feel free to contact me via [Logigreen Consulting](https://www.logi-green.com/).\ For more case studies, check my [Personal Website](https://samirsaci.com).

ML Frameworks Supply Chain
120 Github Stars
ml-forecast-features-eng
Open Source

ml-forecast-features-eng

## Machine Learning for Retail Sales Forecasting — Feature Engineering 📈 *Understand the impacts of additional features related to stock-out, store closing date or cannibalisation on a Machine Learning model for sales forecasting* <p align="center"> <a href="https://www.samirsaci.com/machine-learning-for-retail-sales-forecasting-features-engineering/" target="_blank" rel="noopener noreferrer"> <img align="center" src="https://miro.medium.com/max/1280/1*C6QjcwkJGUmw0sot8pd4Cw.png" style="max-width: 100%; height: auto;" > </a> </p> Based on the feedback of the last Makridakis Forecasting Competitions, Machine Learning models can **reduce the forecasting error by 20% to 60% compared to benchmark statistical models.** Their significant advantage is the ability to integrate external features that significantly affect sales variability. For example, e-commerce cosmetics sales are driven by special events (promotions) and by how you advertise a reference on the website (first page, second page, …). This process called **features engineering** is based on **analytical concepts and business insights** to understand what could drive your sales. ### Article In this [Article](https://www.samirsaci.com/machine-learning-for-retail-sales-forecasting-features-engineering/), we examine the impact of several features on model accuracy using the M5 Forecasting competition dataset. ### Experiment Based on business insights and common sense, we will add features built on existing ones to help our model capture all the key factors affecting your customer demand. <p align="center"> <a href="https://www.samirsaci.com/machine-learning-for-retail-sales-forecasting-features-engineering/" target="_blank" rel="noopener noreferrer"> <img align="center" src="https://miro.medium.com/max/700/1*PBsf-z8n_DrMaCEtaKkhXQ.png" style="max-width: 100%; height: auto;" > </a> </p> ### Data set This analysis will be based on the M5 Forecasting dataset of Walmart store sales records ([Link](https://www.kaggle.com/c/m5-forecasting-accuracy)). ## Code 1. Create a folder named Data in your directory where the notebook is located 2. Download all the files of the Kaggle forecasting competition ([Link](https://www.kaggle.com/c/m5-forecasting-accuracy)). 3. Launch the notebook ## About me 🤓 Senior Supply Chain and Data Science consultant with international experience working on Logistics and Transportation operations.\ For **consulting or advising** on analytics and sustainable supply chain transformation, feel free to contact me via [Logigreen Consulting](https://www.logi-green.com/)\ Please have a look at my personal blog: [Personal Website](https://samirsaci.com)

ML Frameworks Supply Chain
69 Github Stars
supply-chain-sustainability
Open Source

supply-chain-sustainability

# Supply Chain Sustainability Reporting with Python 🌲 *4 steps to build an ESG reporting focusing on CO2 emissions of your Distribution Network* <p align="center"> <a href="https://www.samirsaci.com/supply-chain-sustainability-reporting-with-python/" target="_blank" rel="noopener noreferrer"> <img alt="The image shows a supply chain sustainability report illustrating CO2 emissions from different transportation methods. A distribution center supplies goods to customers through three routes: (1) via road (120 km), air (1450 km), and road again (700 km); (2) directly by road for 200 km; and (3) through road, sea, and road again. Each mode of transportation highlights the distances, representing the CO2 emissions linked to the transportation network’s sustainability calculated with Python." align="center" src="images/intro.png" style="max-width: 75%; height: auto;"> </a> </p> <p align="center">Supply Chain Sustainability Reporting</p> The demand for transparency in sustainable development from investors and customers has grown over the years. Investors have placed greater emphasis on business sustainability when assessing an organisation's value and resilience. Therefore, more organisations are investing resources to build capabilities for sustainability reporting and determine the best strategies for a sustainable supply chain. ### Youtube Video Click on the GIF below to access a short explainer video to understand the concept behind this solution <div align="center"> <a href="https://www.youtube.com/watch?v=yodNWnf7PQ0"><img src="https://github.com/samirsaci/supply-chain-sustainability/blob/main/thumbnail.webp" alt="Explainer Video Link"></a> </div> ## **Article** In this [Article](https://www.samirsaci.com/supply-chain-sustainability-reporting-with-python/), we will introduce a simple methodology to **report the CO2 emissions of your Distribution Network** using **Python and PowerBI**. ## **Definition** Based on the GHG Protocol corporate standard (Link), greenhouse gas emissions are classified into three scopes: - Scope 1: direct emissions released to the atmosphere because of the company’s activities (Company’s facilities like manufacturing plant/warehouses, company’s vehicles) - Scope 2: indirect emissions from the generation of purchased energy (purchased electricity, gas,...) - Scope 3: all indirect emissions (out of scope 2) occurring in the value chain of the company (Transportation, Waste of Operations, Business Travels, …) In this article, we focus on Scope 3 calculations for downstream transportation. What is the environmental impact of your distribution network? ## **Formula** Following the protocol of the French Environmental Agency Ademe, the formula to estimate the CO2 emissions of transportation is: <p align="center"> <a href="https://www.samirsaci.com/supply-chain-sustainability-reporting-with-python/" target="_blank" rel="noopener noreferrer"> <img alt="A mathematical formula to calculate CO2 emissions based on emissions factors. The formula is structured as follows: “CO2 Emissions = Distance × Weight × Emission Factor.” This equation calculates the carbon dioxide emissions by multiplying the distance traveled by the weight of the goods transported and the emission factor (representing the rate of emissions per unit of weight and distance). The formula is used in the context of transportation-related emissions calculations." align="center" src="images/equation.png" style="max-width: 75%; height: auto;"> </a> </p> <p align="center">Formula using Emission Factor</p> ## **Objective** 1. Based on this formula, we collect and process data to calculate the emissions. <p align="center"> <a href="https://www.samirsaci.com/supply-chain-sustainability-reporting-with-python/" target="_blank" rel="noopener noreferrer"> <img alt="The image shows a data model for calculating supply chain CO2 emissions. “Master Data” includes item details like net weight. “Shipped Order Lines” contains shipment info (order number, warehouse, customer). “Business Units” holds warehouse data, while “Address Book” lists customer locations. “Distance by Mode” records transport distances (road, sea, air, rail) between warehouses and customers, used for CO2 emission calculations based on shipment and distance data." align="center" src="images/data collection.png" style="max-width: 75%; height: auto;"> </a> </p> <p align="center">Data to be Collected</p> 2. We calculate the unit of measure conversions considering the shipped handling units. <p align="center"> <a href="https://www.samirsaci.com/supply-chain-sustainability-reporting-with-python/" target="_blank" rel="noopener noreferrer"> <img alt="A flowchart shows three types of order packaging: full pallets, cartons, and individual units. Each order type follows a distinct path for packaging and palletization. For full pallets, the weight reference is the pallet; for cartons, it’s the carton, and for individual units, it’s converted into weight after being packed and palletized. This diagram visualizes how different order types are handled in supply chain processes, with weight reference at each stage of transportation." align="center" src="images/weight reference.png" style="max-width: 75%; height: auto;"> </a> </p> <p align="center">Handling Units</p> 3. We add distances by mode and compute the CO2 emissions by order <p align="center"> <a href="https://www.samirsaci.com/supply-chain-sustainability-reporting-with-python/" target="_blank" rel="noopener noreferrer"> <img alt="" align="center" src="images/emissions factors.png" style="max-width: 75%; height: auto;"> </a> </p> <p align="center">Emission by transportation mode</p> ## **Exemples of visuals using PowerBI** ### Bubble map with size = f(CO2 Total) <p align="center"> <a href="https://www.samirsaci.com/supply-chain-sustainability-reporting-with-python/" target="_blank" rel="noopener noreferrer"> <img alt="A map visualization showing various cities in Europe, marked with blue bubbles. The size of the bubbles represents the total CO2 emissions. Locations include cities in the UK, France, and Germany, illustrating CO2 emissions across different regions of Europe." align="center" src="images/bubble map.png" style="max-width: 75%; height: auto;"> </a> </p> <p align="center">Bubble Map</p> _Visual Insights_ You can observe where you have the majority of CO2 emissions (large bubbles) with a colour coding by transportation mode. ### Split by Country Destination and Item Code <p align="center"> <a href="https://www.samirsaci.com/supply-chain-sustainability-reporting-with-python/" target="_blank" rel="noopener noreferrer"> <img alt="" align="center" src="images/bar chart.png" style="max-width: 75%; height: auto;"> </a> </p> <p align="center">Bar Chart</p> **Product Portfolio Insights** For each market, which item has the highest environmental impact? _Product Portfolio Insights_ For each market, which item has the highest environmental impact? ### CO2 = f(Turnover) by City Destination <p align="center"> <a href="https://www.samirsaci.com/supply-chain-sustainability-reporting-with-python/" target="_blank" rel="noopener noreferrer"> <img alt="A bar chart with horizontal bars representing the total CO2 emissions by customer country. Germany has the highest emissions, followed by the United Kingdom, France, Bulgaria, and Mauritania." align="center" src="images/scatter plot.png" style="max-width: 75%; height: auto;"> </a> </p> <p align="center">Scatter Plot</p> _Financial Insights_ The impact of your future CO2 emission-reduction efforts on profitability will be greater for customers in PEINE-WOLTORF. # Code In this repository, you will find all the code used to explain the concepts presented in the article. ### Files - `Transportation CO2 Emissions Reporting.ipynb` - Jupyter notebook with step-by-step analysis - `co2_emissions_reporting.py` - Standalone Python script - `data/` - Folder containing input CSV files (order_lines.csv, distances.csv, etc.) ### Getting Started ```bash pip install -r requirements.txt python co2_emissions_reporting.py ``` ### Dependencies - pandas ## About me 🤓 Senior Supply Chain and Data Science consultant with international experience working on Logistics and Transportation operations.\ For **consulting or advising** on analytics and sustainable supply chain transformation, feel free to contact me via [Logigreen Consulting](https://www.logi-green.com/).\ For more case studies, check my [Personal Website](https://samirsaci.com).

Supply Chain Data Warehouses
61 Github Stars
container-optimization
Open Source

container-optimization

## Containers Loading Optimization with Python 📦 *How can we use heuristic algorithms to find the right strategy to load a maximum number of pallets in a sea container?* <p align="center"> <img align="center" src="https://miro.medium.com/max/1400/1*CkTDHr6ptOwBM12bLPiW1A.png"> </p> ### Youtube Video Find in the link below a short animated explained video to understand the concept behind this solution <div align="center"> <a href="https://www.youtube.com/watch?v=P1kSt3tedI4"><img src="https://github.com/samirsaci/container-optimization/blob/main/thumbnail.webp" alt="Explainer Video Link"></a> </div> ### Article In this [Article](https://www.samirsaci.com/containers-loading-optimization-with-python/), we will build a container loading optimization model using a heuristic method from a Python library. ### Experiment #### Scenario You need to load in a 40' Container - 20 European Pallets 80 x 120 (cm) - 4 North American Pallets 100 x 120 (cm) #### Tentative 1: The Intuitive solution ![This is an image](https://miro.medium.com/max/700/1*VV3FCo5v75EmtDEgyhpKJg.png) > Results: 20/20 Euro Pallets loaded, 2/4 American pallets loaded. You need another container for the two remaining pallets. #### Tentative 2: The Optimization Algorithm Result ![This is an image](https://miro.medium.com/max/700/1*QvEfxDGR8KiENh9Fp7LD9w.png) > Results: 20/20 Euro Pallets loaded, 4/4 American pallets loaded. You don’t need another container. ## Code This repository code you will find all the code used to explain the concepts presented in the article. ## About me 🤓 Senior Supply Chain and Data Science consultant with international experience working on Logistics and Transportation operations. \ For **consulting or advising** on analytics and sustainable supply chain transformation, feel free to contact me via [Logigreen Consulting](https://www.logi-green.com/). \ For more case studies, have a look at my personal blog: [Personal Website](https://samirsaci.com)

AI & Machine Learning Supply Chain
39 Github Stars
production-planning
Open Source

production-planning

## Production Fixed Horizon Planning with Python 🏭 *Implement the Wagner-Whitin algorithm to minimise the total costs of production given a set of constraints* <p align="center"> <a href="https://www.samirsaci.com/production-fixed-horizon-planning-with-python/" target="_blank" rel="noopener noreferrer"> <img align="center" src="https://miro.medium.com/max/786/1*0gFQPmIuKcGLL7j9G3geQw.png" style="max-width: 100%; height: auto;" > </a> </p> ### Objective Use Python to design an optimal production plan that meets customer demand and minimises total production costs. ### Article In this [Article](https://www.samirsaci.com/production-fixed-horizon-planning-with-python/), we will implement optimal production planning using the Wagner-Whitin method with Python. ### 📘 Your complete guide for Supply Chain Analytics 60+ case studies with source code, dummy data and mathematical concepts here 👉 [Analytics Cheat Sheet](https://bit.ly/supply-chain-cheat) ### Youtube Video Click on the image below to access a full tutorial video to understand the concept behind this solution <div align="center"> <a href="https://www.youtube.com/watch?v=130AKb2DejM"><img src="https://i.ytimg.com/vi/130AKb2DejM/hqdefault.jpg?sqp=-oaymwEcCNACELwBSFTyq4qpAw4IARUAAIhCGAFwAcABBg==&rs=AOn4CLB14U22DUisLrmIqh5gCIlzVNGAog" alt="Explainer Video Link"></a> </div> ### Scenario You are a production planning manager at a small factory producing radio equipment for local and international markets. Customers submit Purchase Orders (POs) to your commercial team, including quantities and expected delivery dates. Your role is to schedule production to deliver on time with a minimum total cost of production that includes - Setup Costs: fixed costs you have each time you set up a production line - Production Costs: variable costs per unit produced - Holding Costs: cost of storage per unit per time - In our example, the customer ordered products for the next 12 months <p align="center"> <img align="center" src="https://miro.medium.com/proxy/1*64ql0685ZVlvW7GJ47VAoA.png"> </p> #### Wagner-Whitin Algorithm This problem can be seen as a generalisation of the economic order quantity model that takes into account that demand for the product varies over time. Wagner and Whitin developed an algorithm for finding the optimal solution by dynamic programming. The idea is to understand each month if adding the current month's demand quantity to past months' orders can be more economic than setting up a new cycle of production. <p align="center"> <img width=60% align="center" src="https://miro.medium.com/max/828/1*UBJpFl8kb7J3s8SytsWPcw.png"> </p> ## Code In this repository, you will find all the code used to explain the concepts presented in the article. ### Files - `Production Fixed Horizon.ipynb` - Jupyter notebook with step-by-step analysis - `production_planning.py` - Standalone Python script ### Getting Started ```bash pip install -r requirements.txt python production_planning.py ``` ### Dependencies - pandas - numpy - matplotlib ## About me 🤓 Senior Supply Chain and Data Science consultant with international experience working on Logistics and Transportation operations.\ For **consulting or advising** on analytics and sustainable supply chain transformation, feel free to contact me via [Logigreen Consulting](https://www.logi-green.com/).\ For more case studies, check my [Personal Website](https://samirsaci.com).

Supply Chain Manufacturing & MRP
32 Github Stars
telegram_transport
Open Source

telegram_transport

## Build a Real-Time Shipment Tracking Tool using a Telegram Bot 🚚 *Design a Telegram Bot that will interact with truck drivers to track your shipments and provide real-time visibility of your transportation performance* ### Youtube Video Find in the link below a short animated explained video to understand the concept behind this solution <div align="center"> <a href="https://www.youtube.com/watch?v=VQNil1uR1js"><img src="https://github.com/samirsaci/telegram_transport/blob/main/thumbnail.webp" alt="Explainer Video Link"></a> </div> ### Article In this [Article](https://www.samirsaci.com/build-a-shipment-tracking-tool-using-a-telegram-bot/), we will implement a simple, cheap and easy-to-implement solution to track your shipments that - Does not require additional IT development for your carriers - Easily integrates into the current transportation processes - Reduces admin workload for your logistics team - Does not impact drivers’ productivity - Does not require additional equipment - Provides visibility, real-time tracking and transparency ### How does it work? Scenario Your shipment has been unloaded in your store. DRIVER wants to send delivery confirmation before leaving for his next destination.\ #### Step 1: DRIVER opens Telegram and starts a discussion with the BOT [![This is an image](https://miro.medium.com/max/315/1*qnBHC99rd8J1Q5xmommMew.png)](https://www.samirsaci.com/build-a-shipment-tracking-tool-using-a-telegram-bot/) #### Step2: DRIVER shares it’s GPS Location (= Store Location) [![This is an image](https://miro.medium.com/max/315/1*c1XgJWH7EH-Lcg5YPQiTWA.png)](https://www.samirsaci.com/build-a-shipment-tracking-tool-using-a-telegram-bot/) #### Step 3: DRIVER shares a delivery number [![This is an image](https://miro.medium.com/max/315/1*Vb3et27oNAnje5sSWgdh0w.png)](https://www.samirsaci.com/build-a-shipment-tracking-tool-using-a-telegram-bot/) #### Step 4: DRIVER shares a picture of the shipment [![This is an image](https://miro.medium.com/max/315/1*7r7RHIWykG3zklrSl2DxPQ.png)](https://www.samirsaci.com/build-a-shipment-tracking-tool-using-a-telegram-bot/) #### Step 5: Your logistics teams receive a shipment confirmation [![This is an image](https://miro.medium.com/max/315/1*V1oEQcRAPxcgCPYN5ywZZA.png)](https://www.samirsaci.com/build-a-shipment-tracking-tool-using-a-telegram-bot/) ## Code This repository code is ready to be deployed on Heroku: ##### 1. Clone the GitHub repository to your local folder and create a local Python environment ##### 2. Download libraries listed in requirements.txt ``` pip3 install -r requirements.txt ``` #### 1. Create your bot with another bot :) @ BotFather is a Telegram bot that will help you create your own bot \ Search @ BotFather on Telegram and send him ‘/start’ \ Answer ‘/newbot’ message and follow instructions to set up a name and a username \ Your bot is now ready, with an API token created—please keep a copy of it! [![This is an image](https://miro.medium.com/max/875/1*FcjfAGjjYuQ_GG8s9dWQQg.png)](https://www.samirsaci.com/build-a-shipment-tracking-tool-using-a-telegram-bot/) #### 2. Take your token and Telegram API keys ``` TOKEN: shared by @ BotFather when you created your bot APP_NAME: address of your Heroku application (see steps below) ``` #### 3. Deploy the code on the cloud Heroku is a cloud-based platform for hosting web applications; its free tier provides sufficient resources to run your app. ``` Procfile requirements.txt ``` #### 4. Test it :) ## About me 🤓 Senior Supply Chain and Data Science consultant with international experience working on Logistics and Transportation operations.\ For **consulting or advising** on analytics and sustainable supply chain transformation, feel free to contact me via [Logigreen Consulting](https://www.logi-green.com/).\ Please have a look at my personal blog: [Personal Website](https://samirsaci.com)

Health & Fitness Supply Chain Fleet & Field Management
27 Github Stars
graph-theory
Open Source

graph-theory

## Transportation Network Analysis with Graph Theory 🚚 *Use the graph theory to optimise the road transportation network of a retail company* <p align="center"> <a href="https://www.samirsaci.com/transportation-network-analysis-with-graph-theory/" target="_blank" rel="noopener noreferrer"> <img align="center" src="https://cdn-images-1.medium.com/max/800/1*J0KtD5r1x0JUTt_YeI2QRA.png" style="max-width: 100%; height: auto;" > </a> </p> ### Objective Build graphical representations of a road transportation network to support network optimisation studies. ### Introduction For a retailer, road transportation between the distribution centre and stores accounts for a significant share of logistics costs.  Companies often conduct route-planning optimisation studies to reduce these costs and improve network efficiency. It requires **collaboration** between continuous improvement engineers and the transportation teams that manage operations daily. ### 📘 Your complete guide for Supply Chain Analytics 60+ case studies with source code, dummy data and mathematical concepts here 👉 [Analytics Cheat Sheet](https://bit.ly/supply-chain-cheat) ### Article In this [Article](https://www.samirsaci.com/transportation-network-analysis-with-graph-theory/), we will use Graph Theory to design visual representations of a transportation network to support this collaboration and facilitate solution design. ### Youtube Video Click on the image below to access a full tutorial video to understand the concept behind this solution <div align="center"> <a href="https://www.youtube.com/watch?v=lhDBTlsGDVc"><img src="https://i.ytimg.com/vi/lhDBTlsGDVc/hqdefault.jpg?sqp=-oaymwEcCNACELwBSFTyq4qpAw4IARUAAIhCGAFwAcABBg==&rs=AOn4CLBW3XmI1zkXElOVtqEQFBBJV-ctrw" alt="Explainer Video Link"></a> </div> ### Scenario As a **continuous improvement engineer** of a retail company, you are in charge of reengineering warehousing and transportation operations. In your scope, you have a major distribution centre located in Shanghai (China) that delivers **54 hypermarkets**. <p align="center"> <a href="https://www.samirsaci.com/transportation-network-analysis-with-graph-theory/" target="_blank" rel="noopener noreferrer"> <img align="center" src="https://cdn-images-1.medium.com/max/800/1*RIXTE99d2grMCtvy5g_0EQ.png" style="max-width: 100%; height: auto;" > </a> </p> #### Objective Your objective is to reduce the total cost of transportation. #### Insights: Cost per Ton The objective is to design a new transportation plan to increase the average truck size by delivering more stores per route. <p align="center"> <a href="https://www.samirsaci.com/transportation-network-analysis-with-graph-theory/" target="_blank" rel="noopener noreferrer"> <img align="center" src="https://cdn-images-1.medium.com/max/800/1*UCtbo4w43ZghEHtXtTuVuQ.png" style="max-width: 100%; height: auto;" > </a> </p> #### Solution: Graph Theory A graph is a structure that consists of nodes (vertices) and edges, where each edge connects two nodes. <p align="center"> <a href="https://www.samirsaci.com/transportation-network-analysis-with-graph-theory/" target="_blank" rel="noopener noreferrer"> <img align="center" src="https://cdn-images-1.medium.com/max/800/1*YqUdhRzq9vHfuslfKFInCA.png" style="max-width: 100%; height: auto;" > </a> </p> #### Further Analysis With these graphs, you can challenge the current routing and discuss optimisation levers with the transportation teams. <p align="center"> <a href="https://www.samirsaci.com/transportation-network-analysis-with-graph-theory/" target="_blank" rel="noopener noreferrer"> <img align="center" src="https://cdn-images-1.medium.com/max/800/1*vrsJmzuXzrFMy_qA4FuvVg.png" style="max-width: 100%; height: auto;" > </a> </p> ## Code In this repository, you will find all the code used to explain the concepts presented in the article. ### Files - `Network Graph.ipynb` - Jupyter notebook with step-by-step analysis - `network_graph.py` - Standalone Python script - `data/` - Folder containing input data (store province.xlsx, delivery records.xlsx) ### Getting Started ```bash pip install -r requirements.txt python network_graph.py ``` ### Dependencies - numpy - pandas - matplotlib - networkx - openpyxl ## About me 🤓 Senior Supply Chain and Data Science consultant with international experience working on Logistics and Transportation operations. \ For **consulting or advising** on analytics and sustainable supply chain transformation, feel free to contact me via [Logigreen Consulting](https://www.logi-green.com/). \ Please have a look at my personal blog: [Personal Website](https://samirsaci.com)

Analytics & BI Maps & Location Supply Chain
24 Github Stars
pareto-warehouse-layout
Open Source

pareto-warehouse-layout

## Reduce Warehouse Space with the Pareto Principle using Python 📦 *How the 80/20 rule implemented using Python can optimise your layout, reduce space utilisation, and improve the picking productivity* An Italian economist named Vilfredo Pareto developed 1906 a mathematical formula to describe the distribution of wealth in Italy. He discovered that 80% of the wealth belonged to 20% of the population. [![Pareto](https://miro.medium.com/max/325/0*f_q2eTFSRsMvk-DZ.jpg)](https://www.samirsaci.com/reduce-warehouse-space-with-the-pareto-principle-using-python/) A few decades later, this rule has been generalised to many other applications, including Supply Chain and Logistics Management. This principle, called the “Pareto Principle”, “the 80–20 rule” or “The Law of Trivial Many and Critical Few”, can be translated for Logistics Practitioners - 80% of your company's revenue is made from 20% of your reference - 80% of your volume is picked in 20% of your picking locations - 80% of your replenishment volume will be performed on 20% of your picking locations ### Youtube Video Find in the link below a short animated video to explain the concept behind this solution <div align="center"> <a href="https://www.youtube.com/watch?v=BRjhhdWjPc4" target="_blank" rel="noopener noreferrer"> <img src="https://github.com/samirsaci/pareto-warehouse-layout/blob/master/thumbnail.webp?raw=true" alt="Explainer Video Link" style="max-width: 100%; height: auto;" > </a> </div> ### Article In this [Article](https://www.samirsaci.com/reduce-warehouse-space-with-the-pareto-principle-using-python/), we will explore how to apply the Pareto Principle to optimise the layout of a Warehouse - 1 month of picking orders - 144,339 order lines - 59,372 orders - 4,864 active references [![This is an image](https://miro.medium.com/max/581/1*IflUKgeDKIjSiaOkdP1mnw.png)](https://www.samirsaci.com/reduce-warehouse-space-with-the-pareto-principle-using-python/) ## Code In this repository, you will find all the code used to explain the concepts tackled in the article with a dataset of orders. ### Files - `Pareto Analysis.ipynb` - Jupyter notebook with step-by-step analysis - `pareto_analysis.py` - Standalone Python script - `data/` - Folder containing input data (1-2017.csv) ### Getting Started ```bash pip install -r requirements.txt python pareto_analysis.py ``` ### Dependencies - pandas - matplotlib - openpyxl ## About me 🤓 Senior Supply Chain and Data Science consultant with international experience working on Logistics and Transportation operations. \ For **consulting or advising** on analytics and sustainable supply chain transformation, feel free to contact me via [Logigreen Consulting](https://www.logi-green.com/) \ Please have a look at my personal blog: [Personal Website](https://samirsaci.com)

Analytics & BI Inventory Management
22 Github Stars
geocoding-api
Open Source

geocoding-api

## Build Your Free GPS Routing API with Python Flask 🗺️ *Build your free Distance Matrix API deployed on the cloud* ### Article In this [Article](https://www.samirsaci.com/build-a-gps-routing-api-with-python-flask/), we will create a free, easy-to-implement and customizable (and a bit slow :D) Distance Matrix API using Flask with a Selenium Bot deployed on Heroku ### How does it work? Before you read this section, please forget everything you know about how to put in production fast, efficient, and stable code that guarantees quick response with limited resources. This will be simple, quick, and dirty, with no intention of being a scalable solution. The performance will be way lower than if you directly query the official Google API — but here it’s free :) [![This is an image](https://miro.medium.com/max/875/1*YqhaaI7ZuXfgAiGuuy166A.png)](https://www.samirsaci.com/build-a-gps-routing-api-with-python-flask/) #### Let us do it in three steps 1. Build a Selenium Bot that will query the distance from City A to City B on the Google Maps website. 2. Set up your Flask API that will receive the request and return a distance 3. Deploy your code on Heroku ## Code This repository code is ready to be deployed on Heroku: ##### 1. Clone the GitHub repository to your local folder and create a local Python environment ##### 2. Download libraries listed in requirements.txt ``` pip3 install -r requirements.txt ``` ##### 3. Download Buildpacks on Heroku to use Selenium + ChromeDriver Go to settings > Add Buildpack [![This is an image](https://miro.medium.com/max/875/1*mDsg_6F14SKeeds0kdHlwg.png)](https://www.samirsaci.com/build-a-gps-routing-api-with-python-flask/) ``` Enter Two Links https://github.com/heroku/heroku-buildpack-google-chrome https://github.com/heroku/heroku-buildpack-chromedriver ``` ##### 4. Set up Environment Variables on Heroku [![This is an image](https://miro.medium.com/max/875/1*2ENP1_ndBVoaSamUXUtVxw.png)](https://www.samirsaci.com/build-a-gps-routing-api-with-python-flask/) ``` CHROMEDRIVER_PATH: /app/.chromedriver/bin/chromedriver GOOGLE_CHROME_BIN: /app/.apt/usr/bin/google-chrome ``` ##### 5. Deploy your app on Heroku ## Test your API #### Test your API to calculate the distance ``` From: Paris, France To: Marseille, France ``` #### Request link http://xxx-xxx.herokuapp.com/distance/Paris,France/Marseille,France (replace xxx-xxx by your Heroku app name) #### Response {“distance”:”775 km”} ## About me 🤓 Senior Supply Chain Engineer with international experience working on Logistics and Transportation operations. \ Have a look at my portfolio: [Data Science for Supply Chain Portfolio](https://samirsaci.com) \ For **consulting or advising** on analytics and sustainable supply chain transformation, feel free to contact me via [Logigreen Consulting](https://www.logi-green.com/)

Supply Chain Route Planning
16 Github Stars
visuals_analysis
Open Source

visuals_analysis

Use Python to build visualizations that will provide visibility on key Supply Chain Metrics

Supply Chain Data Visualisation
16 Github Stars
supply-planning
Open Source

supply-planning

## Supply Planning using Linear Programming with Python 🚛 *Where do you need to allocate your stock to meet customers' demand and reduce your transportation costs?* <p align="center"> <a href="https://www.samirsaci.com/supply-planning-using-linear-programming-with-python/" target="_blank" rel="noopener noreferrer"> <img align="center" src="https://miro.medium.com/max/1280/1*y4AHwh75uQ771dEdO6sxJg.png" style="max-width: 100%; height: auto;" > </a> </p>> Supply planning is the process of managing the inventory produced by manufacturing to fulfil the requirements created from the demand plan. Your goal is to balance supply and demand to ensure the best service level at the lowest cost. ### Article In this [Article](https://www.samirsaci.com/supply-planning-using-linear-programming-with-python/), we will present a simple methodology to use Integer Linear Programming to answer a complex Supply Planning Problem, considering: - Inbound Transportation Costs from the Plants to the Distribution Centres (DC) ($/Carton) - Outbound Transportation Costs from the DCs to the final customer ($/Carton) - Customer Demand (Carton) ### Problem Statement As a Supply Planning manager at a mid-sized manufacturing company, you received feedback that distribution costs are too high. Based on the Transportation Manager's analysis, this is primarily due to the stock allocation rules. In some cases, your customers are not shipped by the closest distribution centre, which impacts your freight costs. ### Your Distribution Network - 2 plants producing products with infinite capacity *Note: we’ll see later how we can improve this assumption easily* - 2 distribution centres that receive finished goods from the two plants and deliver them to the final customers *Note: We will consider that these warehouses operate X-Docking to avoid considering the concept of stock capacity in our model 200 stores (delivery points)* ### Question Which Plant i and Distribution n should I choose to produce and deliver 100 units to Store p at the lowest cost? ## Code In this repository, you will find all the code used to explain the concepts presented in the article. ### Files - `Supply Planning Problem.ipynb` - Jupyter notebook with step-by-step analysis - `supply_planning.py` - Standalone Python script - `data/` - Folder containing input CSV files (df_demand.csv, df_inprice.csv, df_outprice.csv) ### Getting Started ```bash pip install -r requirements.txt python supply_planning.py ``` ### Dependencies - pandas - pulp - matplotlib - seaborn ## About me 🤓 Senior Supply Chain and Data Science consultant with international experience working on Logistics and Transportation operations.\ For **consulting or advising** on analytics and sustainable supply chain transformation, feel free to contact me via [Logigreen Consulting](https://www.logi-green.com/).\ For more case studies, check my [Personal Website](https://samirsaci.com).

ML Frameworks Supply Chain
15 Github Stars
workforce-planning
Open Source

workforce-planning

## Optimise Workforce Planning using Linear Programming with Python 👷 *What is the minimum number of temporary workers you need to hire to absorb your weekly workload while ensuring employee retention?* <p align="center"> <a href="https://www.samirsaci.com/optimize-workforce-planning-using-linear-programming-with-python/" target="_blank" rel="noopener noreferrer"> <img alt="A diagram showing different aspects of the workforce planning problem, including time constraints, tasks planning, schedule constraints, workload forecasting, and workforce planning. The diagram outlines how these factors interact to optimize workforce management with Python." align="center" src="https://www.samirsaci.com/content/images/size/w1200/2025/12/temp-51.png" style="max-width: 100%; height: auto;" > </a> </p> ### Youtube Video Find in the link below a short animated video to explain the concept behind this solution: <div align="center"> <a href="https://www.youtube.com/watch?v=OdLeRR4rvt0"><img src="https://github.com/samirsaci/workforce-planning/blob/main/thumbnail.webp" alt="Explainer Video Link"></a> </div> ### Article In this [Article](https://www.samirsaci.com/optimize-workforce-planning-using-linear-programming-with-python/), we will build a linear optimisation to calculate the number of workers needed to ensure the proper resource allocation while reducing costs. [![This is an image](https://www.samirsaci.com/content/images/2025/12/image-1193.png)](https://www.samirsaci.com/optimize-workforce-planning-using-linear-programming-with-python/) ## Code In this repository, you will find all the code used to explain the concepts presented in the article. ### Files - `Linear Optimization Examples.ipynb` - Jupyter notebook with step-by-step analysis - `workforce_planning.py` - Standalone Python script ### Getting Started This project uses [uv](https://docs.astral.sh/uv/) for dependency management. ```bash # Install dependencies uv sync # Run the Python script uv run python workforce_planning.py # Or launch Jupyter notebook uv run jupyter notebook ``` ### Dependencies - pandas - pulp - matplotlib - jupyter ## About me 🤓 Senior Supply Chain and Data Science consultant with international experience working on Logistics and Transportation operations.\ For **consulting or advising** on analytics and sustainable supply chain transformation, feel free to contact me via [Logigreen Consulting](https://www.logi-green.com/).\ For more case studies, check my [Personal Website](https://samirsaci.com).

HR & Payroll Supply Chain
14 Github Stars
queing-theory
Open Source

queing-theory

## Supply Chain Process Design using the Queueing Theory 🧑‍🤝‍🧑 *Apply several principles of the Queueing Theory with Python to design a parcel packing process for an e-commerce fulfilment centre* <p align="center"> <a href="https://www.samirsaci.com/supply-chain-process-design-using-the-queueing-theory/" target="_blank" rel="noopener noreferrer"> <img align="center" src="https://miro.medium.com/max/1280/1*Xl06F_IZt-FVaB9nJP3qdA.png" style="max-width: 100%; height: auto;" > </a> </p> Supply Chain can be defined as a network of processes and stock locations built to deliver services and goods to customers. This network usually supports the business strategy of your company; its objectives can be diverse, such as delivering the best quality products, the lowest cost or the most customised service or product in the market. As a Supply Chain Engineer, your objective is to design the most efficient processes to ensure a good service level for your customers and profitability. ### Youtube Video Find in the link below a short animated video to explain the concept behind this solution <div align="center"> <a href="https://www.youtube.com/watch?v=COcoxQ8NhzM"><img src="https://github.com/samirsaci/queing-theory/blob/main/thumbnail.webp" alt="Explainer Video Link"></a> </div> ### Article In this [Article](https://www.samirsaci.com/supply-chain-process-design-using-the-queueing-theory/), we will apply principles from the Queueing Theory with Python to design a process for parcel packing in an E-Commerce Fulfilment Centre. ### Scenario You are the Outbound Manager of a multinational clothing retail company known for its fast-fashion clothing for men, women, teenagers, and children. A major problem you’re facing is outbound productivity; after picking up your orders, they are waiting too long to be shipped. Based on on-site observations and In the productivity analysis, you understood that the packing process was the bottleneck. #### 1. Warehouse Pickers bring the parcels on a trolley and put them on the conveyor <p align="center"> <a href="https://www.samirsaci.com/supply-chain-process-design-using-the-queueing-theory/" target="_blank" rel="noopener noreferrer"> <img align="center" src="https://miro.medium.com/max/700/1*WYwCXoRYTm48idYEIDsSwQ.png" style="width: 50%; height: auto;" > </a> </p> #### 2. Packing Operator: Takes the parcels from the conveyor, performs a quantity check, and packs (puts filling material, closes the box) <p align="center"> <a href="https://www.samirsaci.com/supply-chain-process-design-using-the-queueing-theory/" target="_blank" rel="noopener noreferrer"> <img align="center" src="https://miro.medium.com/max/700/1*WYwCXoRYTm48idYEIDsSwQ.png" style="width: 50%; height: auto;" > </a> </p> ### Objective You've received approval from your management to invest in a second packing station and are wondering how to design the layout. #### Solution 1: keep a single line with two parallel stations <p align="center"> <a href="https://www.samirsaci.com/supply-chain-process-design-using-the-queueing-theory/" target="_blank" rel="noopener noreferrer"> <img align="center" src="https://miro.medium.com/max/700/1*Yg0h2TH2v3mh-1eckO0dqg.png" style="width: 50%; height: auto;" > </a> </p> #### Solution 2: add a second line with a dedicated station <p align="center"> <a href="https://www.samirsaci.com/supply-chain-process-design-using-the-queueing-theory/" target="_blank" rel="noopener noreferrer"> <img align="center" src="https://miro.medium.com/max/700/1*Y5DjsFFTae4L2NOzqhxGtg.png" style="width: 50%; height: auto;" > </a> </p> > What is the most efficient (Packing Productivity) solution? ## Code In this repository, you will find all the code used to explain the concepts presented in the article. ## About me 🤓 Senior Supply Chain and Data Science consultant with international experience working on Logistics and Transportation operations. \ For **consulting or advising** on analytics and sustainable supply chain transformation, feel free to contact me via [Logigreen Consulting](https://www.logi-green.com/). \ Please have a look at my personal blog: [Personal Website](https://samirsaci.com)

Database Supply Chain
12 Github Stars
procurement-management
Open Source

procurement-management

## Procurement Process Optimisation with Python 🚛 *Use non-linear programming to find the optimal ordering policy that minimises capital, transportation and storage costs* <p align="center"> <a href="https://www.samirsaci.com/procurement-process-optimization-with-python/" target="_blank" rel="noopener noreferrer"> <img align="center" src="https://miro.medium.com/max/1280/1*LlLZcqtUGUdqwLHSfF_N3g.png" style="max-width: 100%; height: auto;" > </a> </p> Procurement management is a strategic approach to acquiring goods or services from preferred vendors within your defined budget, on or before a specific deadline. Your goal is to balance supply and demand, so you maintain a minimum inventory level to meet your store's demand. ### Article In this [Article](https://www.samirsaci.com/procurement-process-optimization-with-python/), we will present a simple methodology using Non-Linear Programming to design an optimal inventory replenishment strategy for a mid-size retail store, considering - Transportation Costs from the Supplier Warehouse to the Store Reserve ($/Carton) - Costs to finance your inventory (% of inventory value in $) - Reserve (Store’s Warehouse) Rental Costs for storage ($/Carton) ### Problem Statement As a Store Manager at a mid-sized retail location, you are responsible for setting replenishment quantities in the ERP. For each SKU, when the inventory level falls below a defined threshold, your ERP system automatically issues a Purchase Order (PO) to your supplier. You need to balance stock capacity, transportation costs, and inventory costs to determine the right quantity for your PO. ### Question Which Quantity per replenishment (Qi) should you set in the ERP to minimise total costs? ## Code In this repository, you will find all the code used to explain the concepts presented in the article. ### Files - `Procurement Strategy with Python.ipynb` - Jupyter notebook with step-by-step analysis - `procurement_optimization.py` - Standalone Python script ### Getting Started ```bash pip install -r requirements.txt python procurement_optimization.py ``` ### Dependencies - pandas - pulp - numpy - scipy ## About me 🤓 Senior Supply Chain and Data Science consultant with international experience working on Logistics and Transportation operations.\ For **consulting or advising** on analytics and sustainable supply chain transformation, feel free to contact me via [Logigreen Consulting](https://www.logi-green.com/).\ For more case studies, check my [Personal Website](https://samirsaci.com).

Inventory Management Supply Chain
11 Github Stars